Preference Testing in Qatalyst
Qatalyst offers a test block feature that allows users to conduct preference testing on various elements of the product. Users can add different versions of an element, such as two different designs, and ask users which one they prefer. This data can be used to inform product development decisions and optimize the product's design and features.
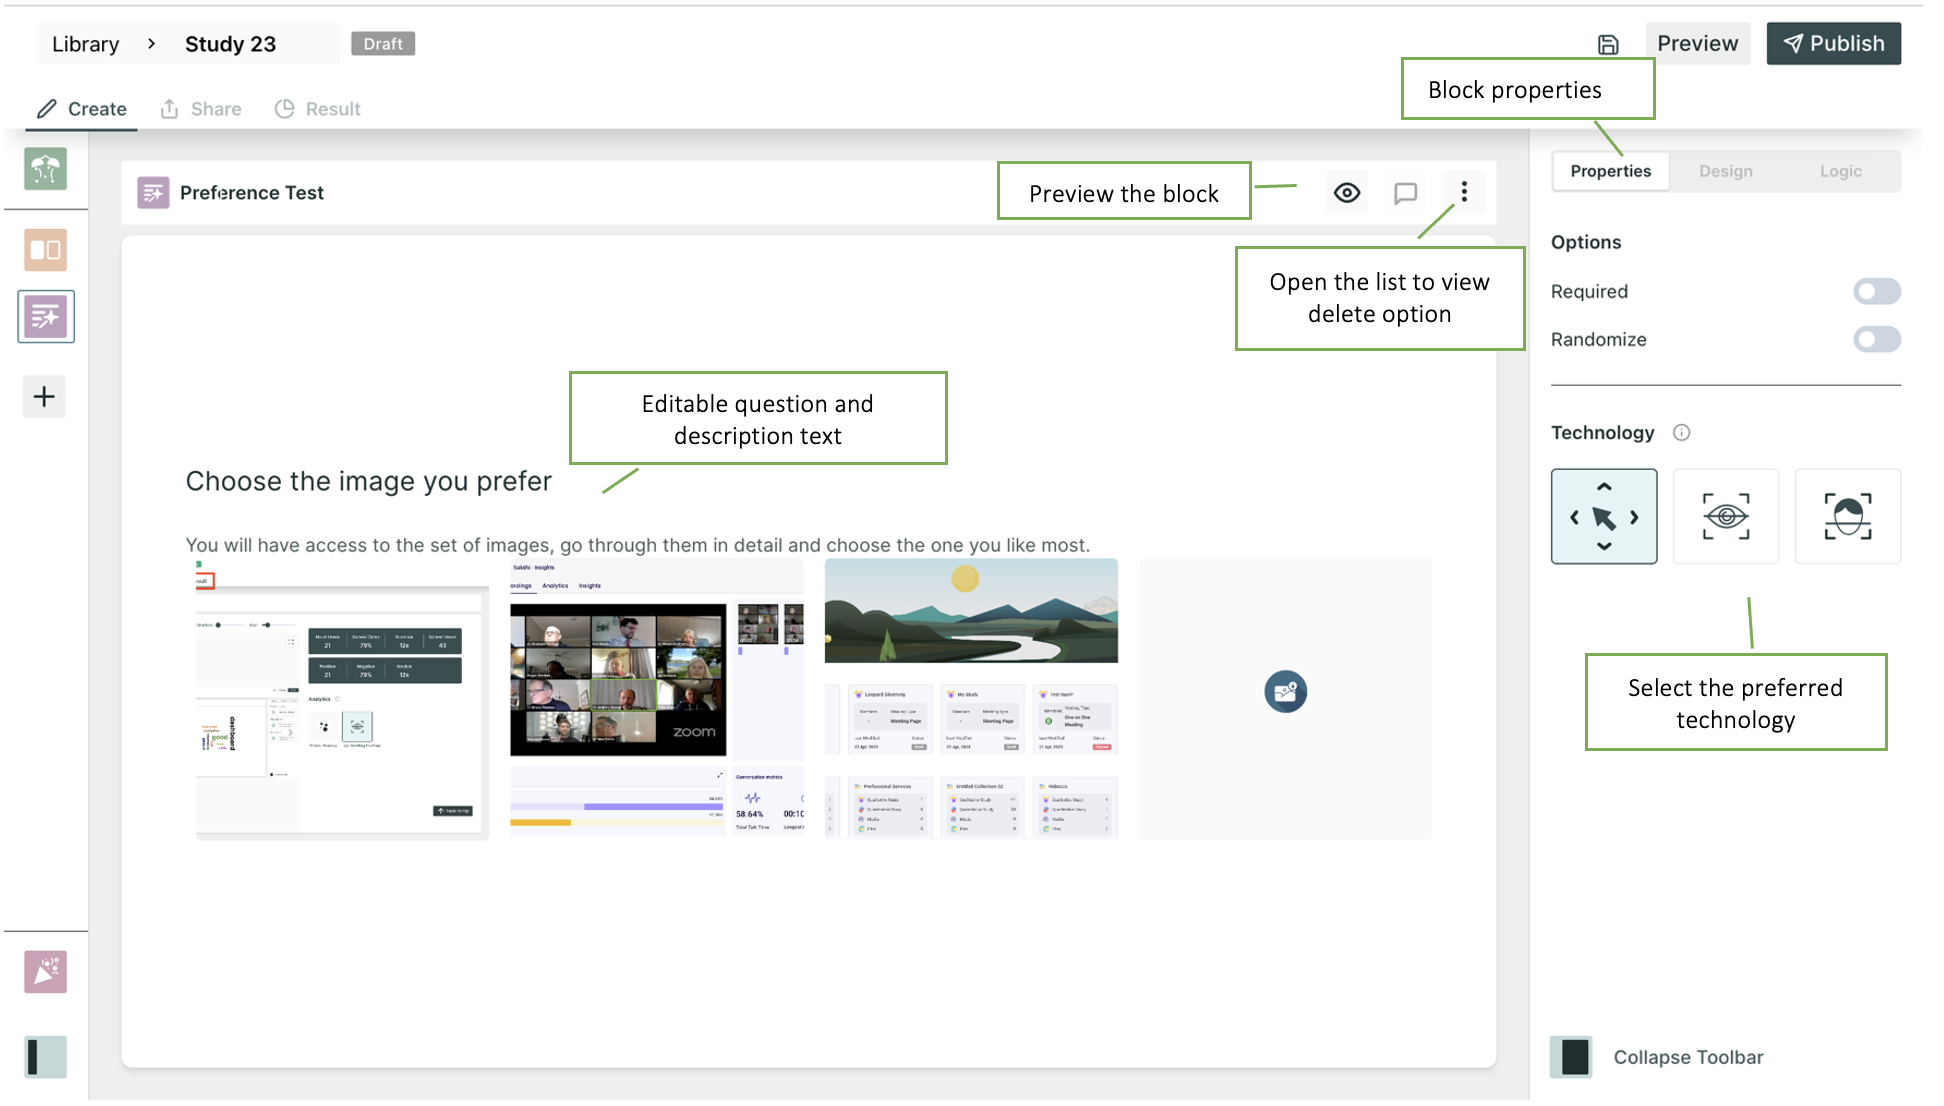
Properties
- Required: Taking this test is mandatory; the respondent will not be able to move to another question without taking this test.
- Randomize: The image options will appear in random order.
Technology
- Mouse Tracking: Mouse tracking is a technology that records the movement of the user's cursor on the screen as they interact with the design. This technology can provide insights into how users navigate through the design.
- Eye tracking: Eye tracking is a technology that records the movement of the user's eyes as they interact with the design. This technology can provide insights into which elements of the design users are looking for, which areas are most engaging, and which areas may need improvement.
- Facial Coding: Facial coding is a technology that is used to analyze users' facial expressions as they interact with the design. This technology can provide insights into users' emotional responses to the product. It can be used to optimize the product's design and messaging to elicit more positive emotional responses from users.
To select the technologies, click on the boxes.
You can select more than one tracking technology at once too.
Result View 📊
Once the respondents have taken the test, you will be able to see the analytics in the result section.
On the first dashboard of the result, you will be presented with valuable quantitative data showcasing the percentage of respondents who have chosen each respective image.
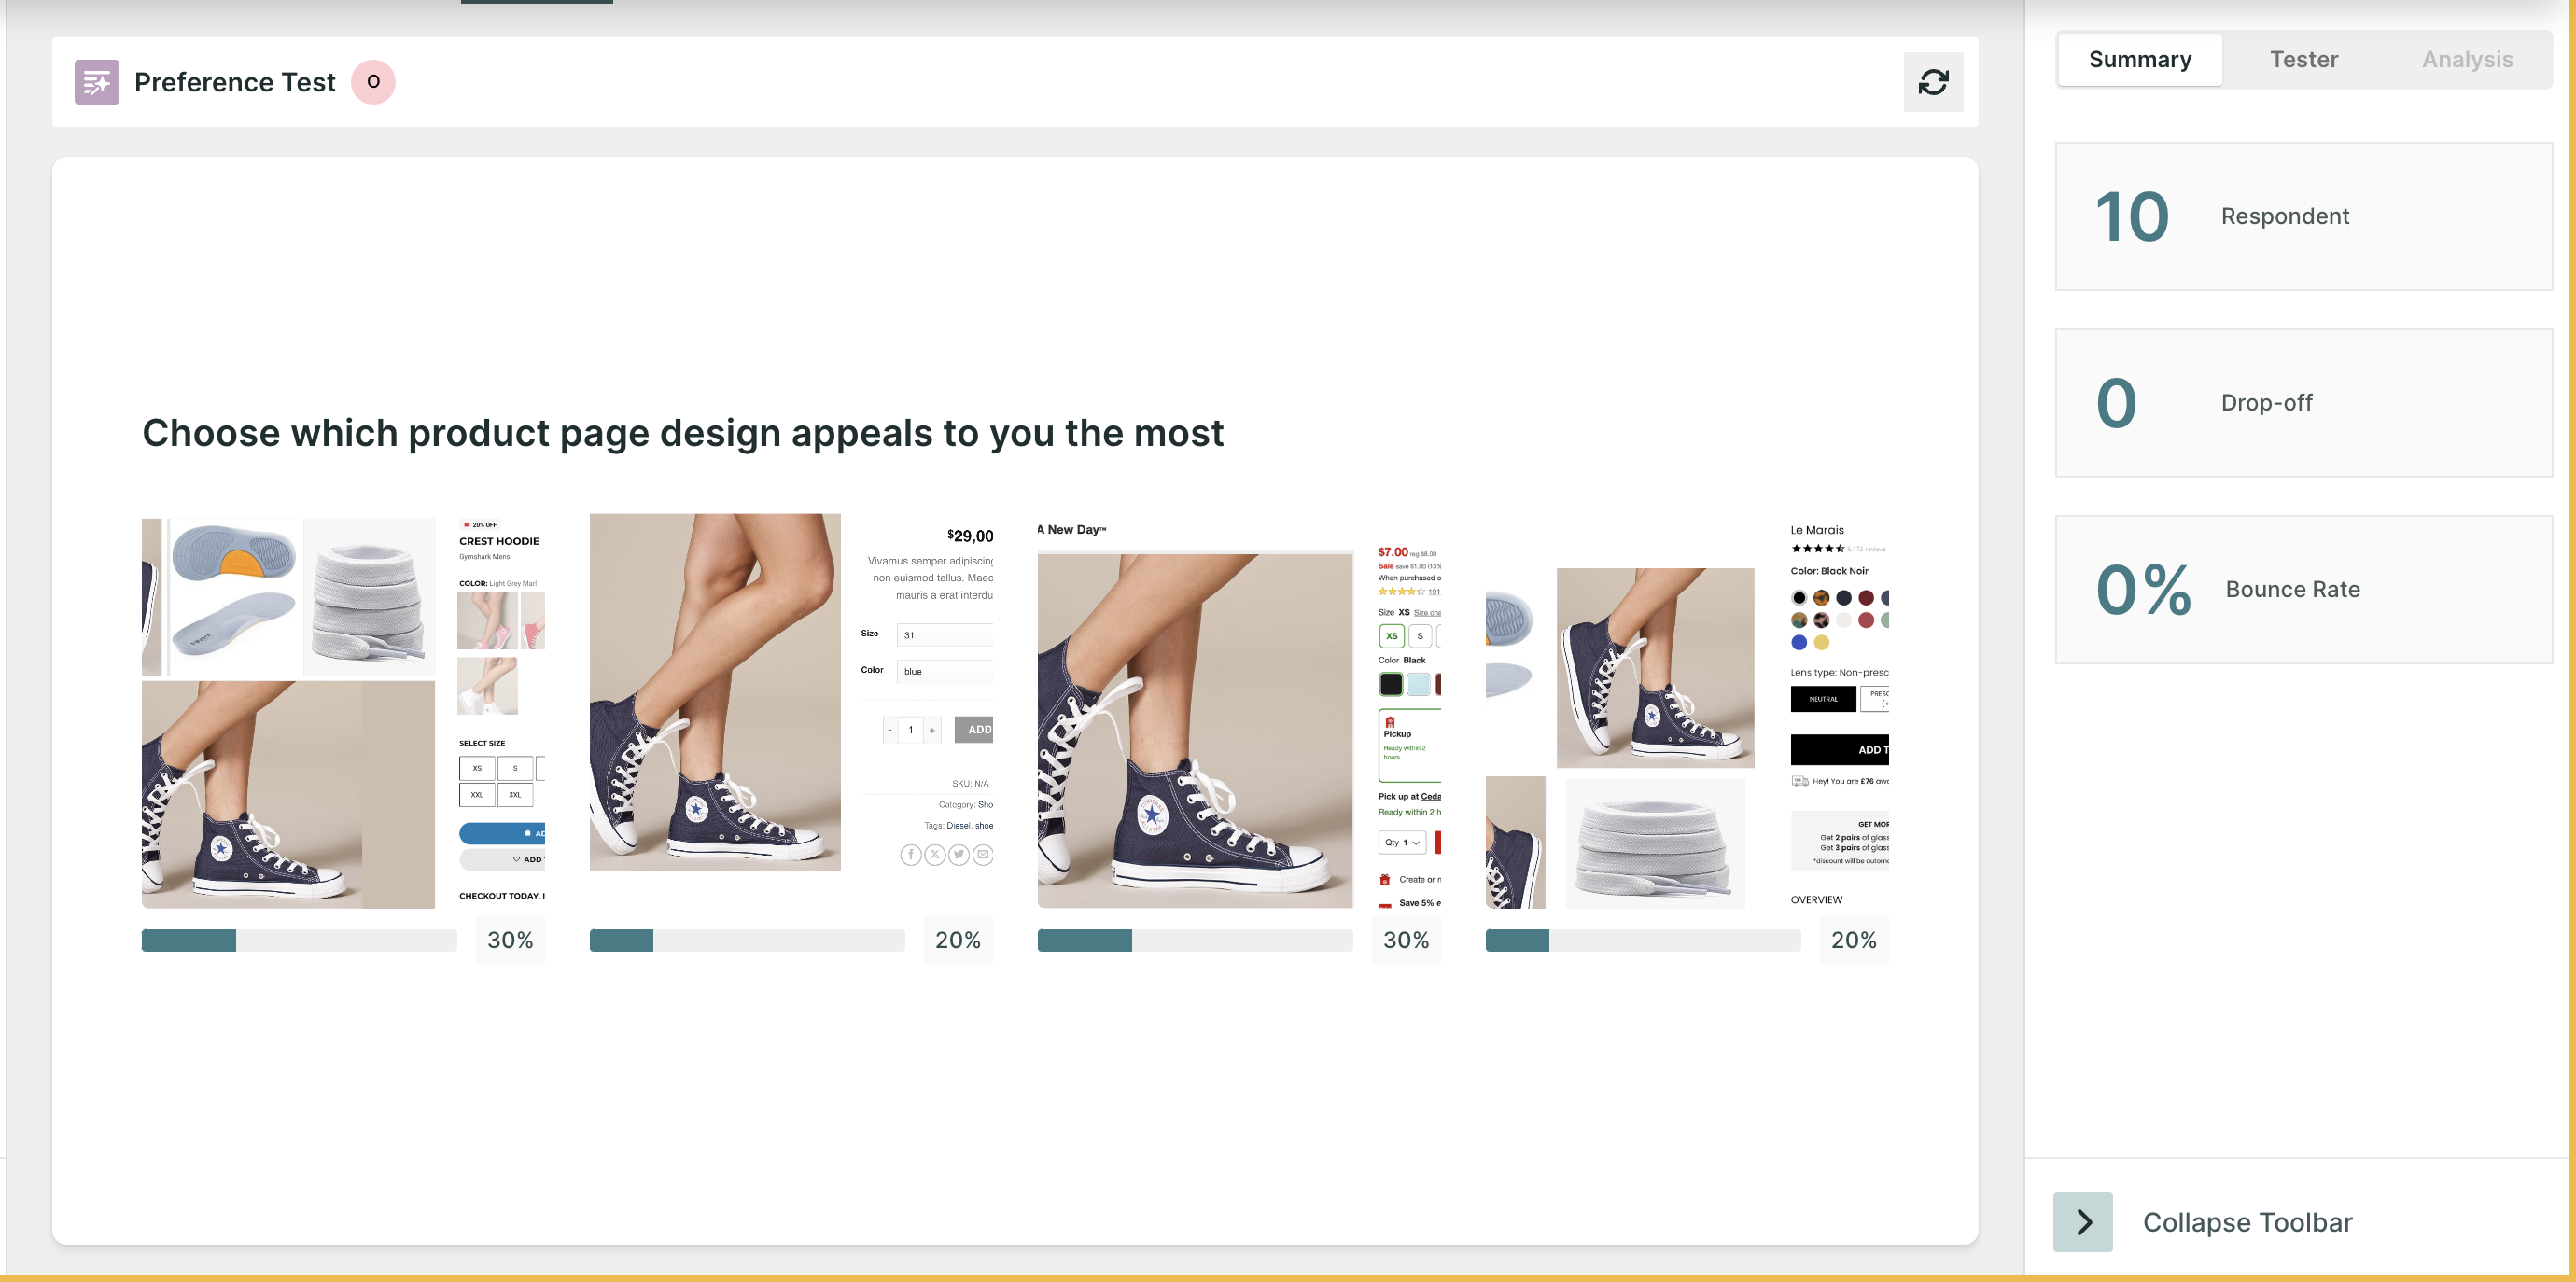
- Respondents: Number of people who initiated the test block.
- Skip: The Number of people who choose to skip the block.
- Drop-off: Number of people who have not moved on to the next block.
- Bounce Rate: ((Dropoff + Skip)/ Number of Responses)*100 . (In Percentage)
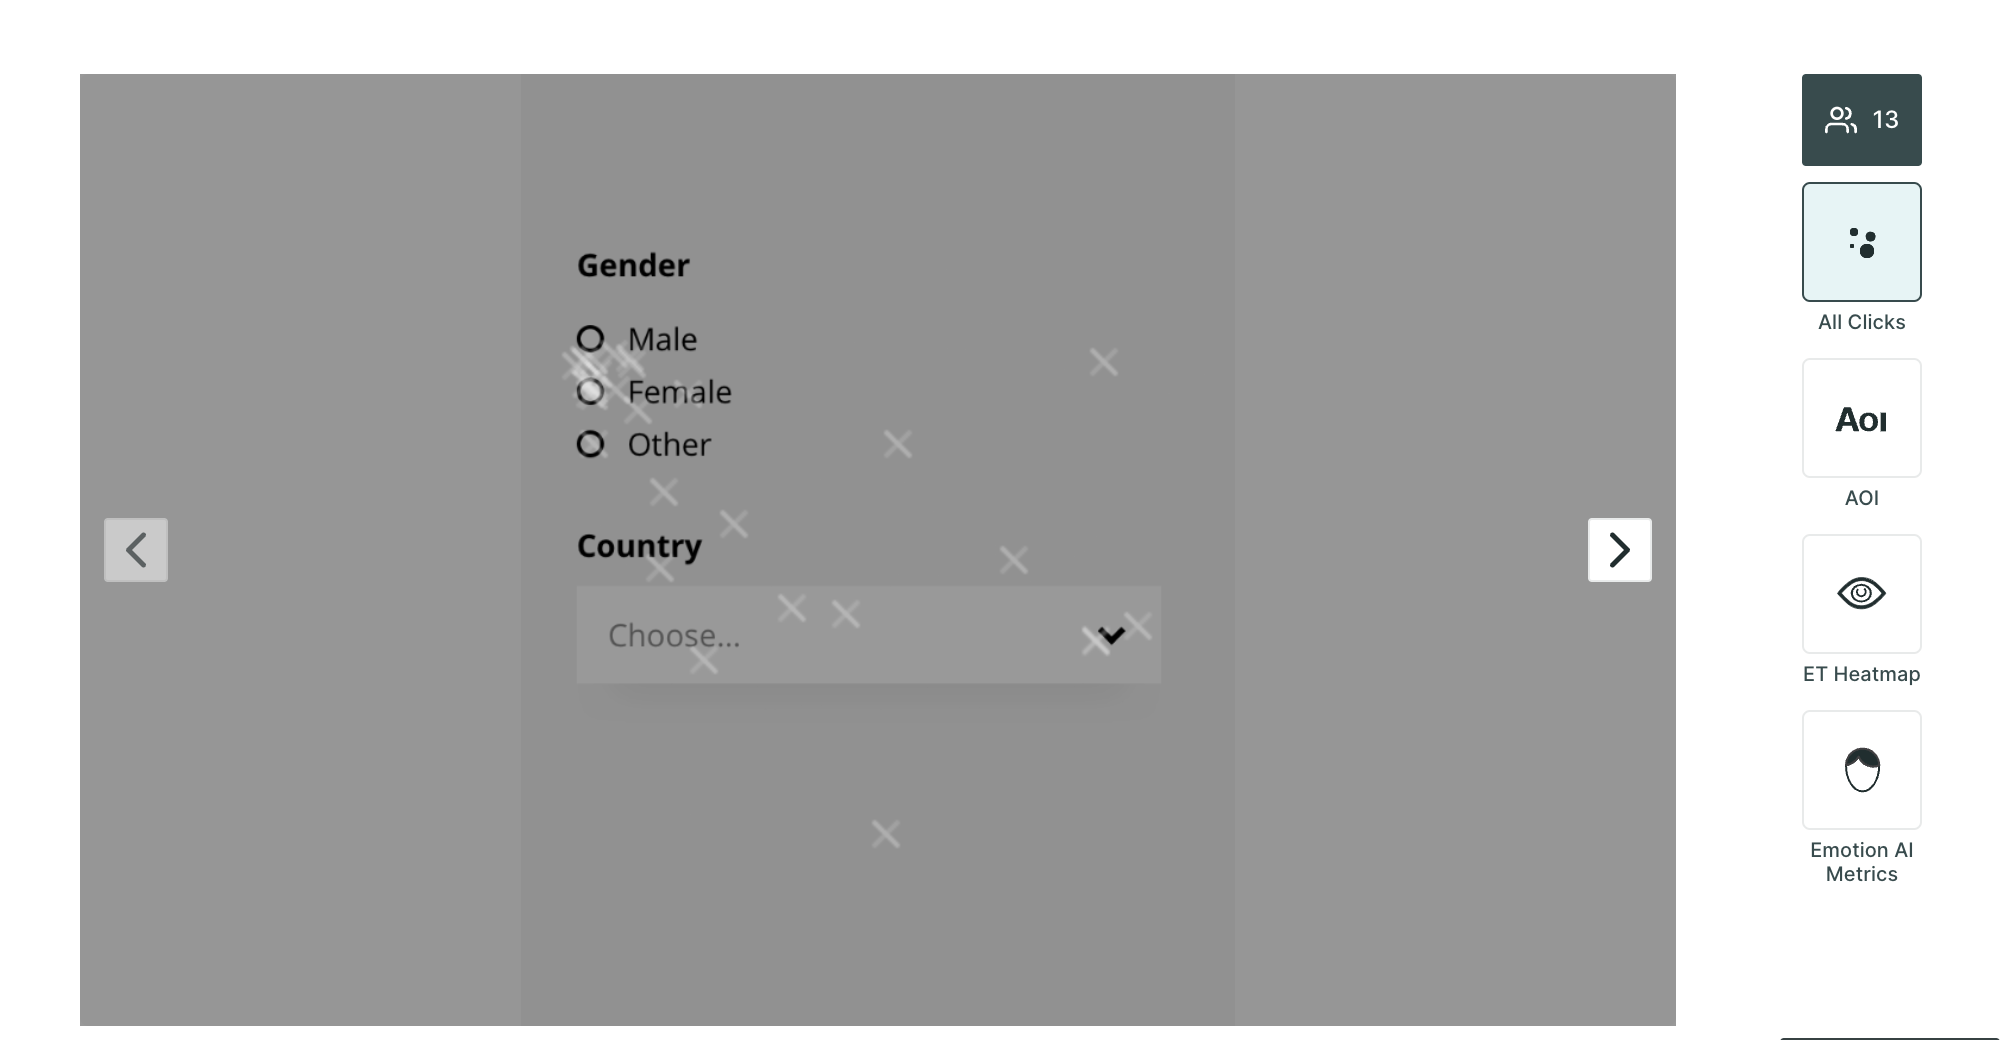
On the next screen, based on the technology selected, you will find the following metrics:
- All clicks: All Clicks metrics provide insights on the clicks made by the respondents on the image. It gives a complete view of how users interact with the image. The size of a click depends on how many times respondents have clicked in that area. This helps us understand which parts of the picture are getting more attention from users.
- AOI (Area of Interest): On the image, you can create AOIs. Within AOIs, you can glean insights into metrics such as time spent, average time to first fixation, and average fixation duration providing a deeper understanding of user engagement.

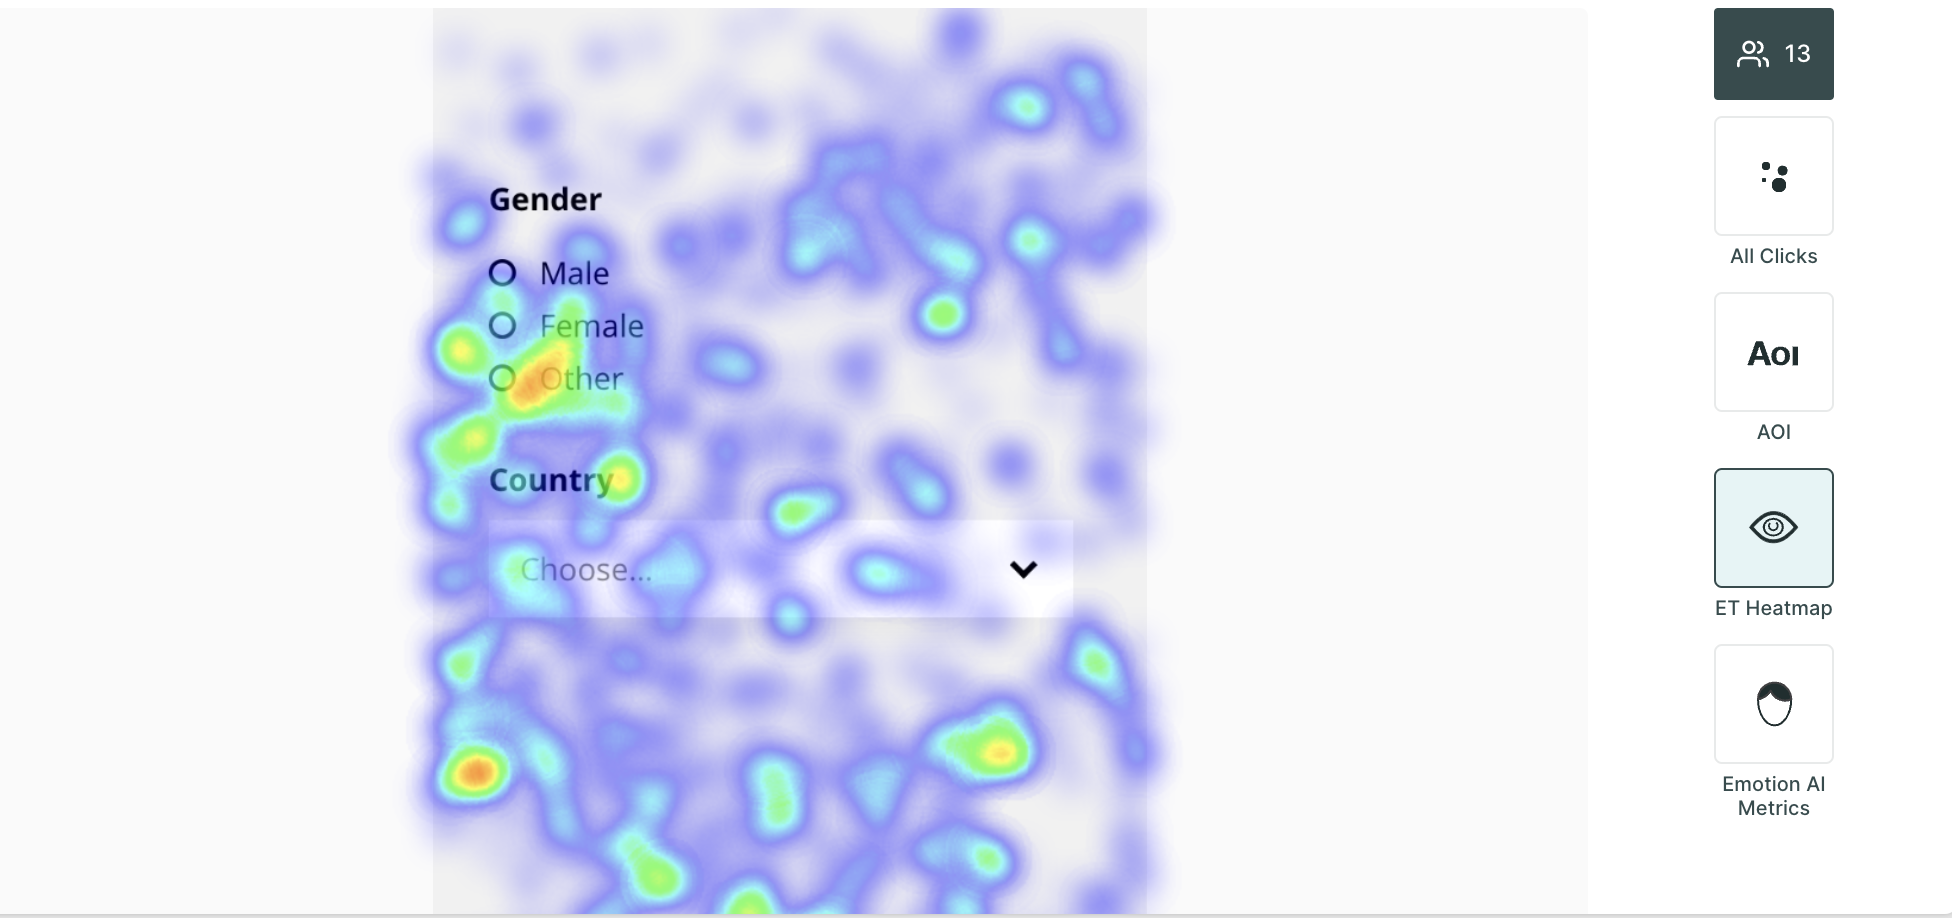
- ET Heatmap: An eye-tracking heatmap is a visual representation of where people look on a page. It is created by tracking the eye movements of users as they interact with the image. The heatmap then shows the areas of the screen that received the most attention, with the hottest areas being those that were looked at the most.
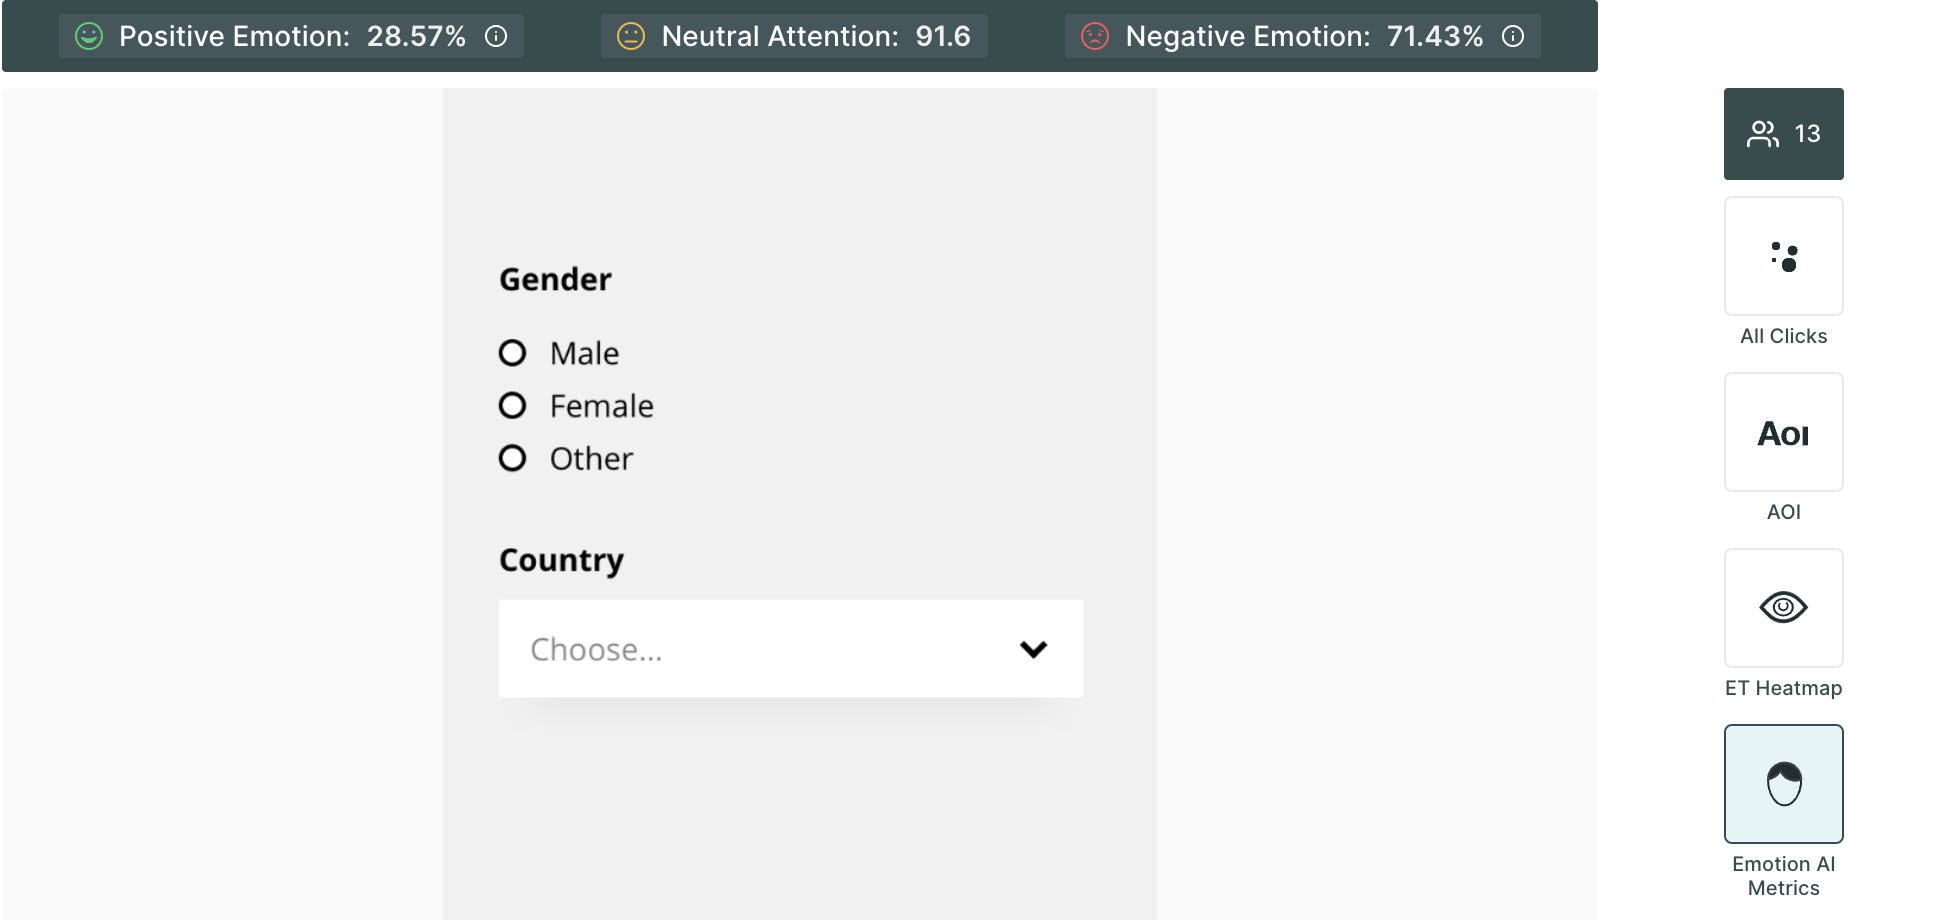
- Emotion AI Metrics: Dive into the emotional resonance of your content with metrics that categorize user responses as neutral, positive, or negative, allowing you to gauge the emotional impact of your design or content.