
5 Second Testing in Qatalyst
Qatalyst offers a test block feature that allows users to conduct 5-second testing. The 5-second test is a type of UX research that involves showing users a screenshot or a design for 5 seconds and then asking them questions about what they remember or what they think the design is about. The idea is to simulate a user's first impression of a website or app and capture their immediate reactions.
Create a 5-second Test👩🏻💻
To create a 5-second test, follow these simple steps:
Step 1: Log in to your Qatalyst account, which will direct you to the dashboard. From the dashboard, click on the "Create Study" button to initiate the process of creating a new study.
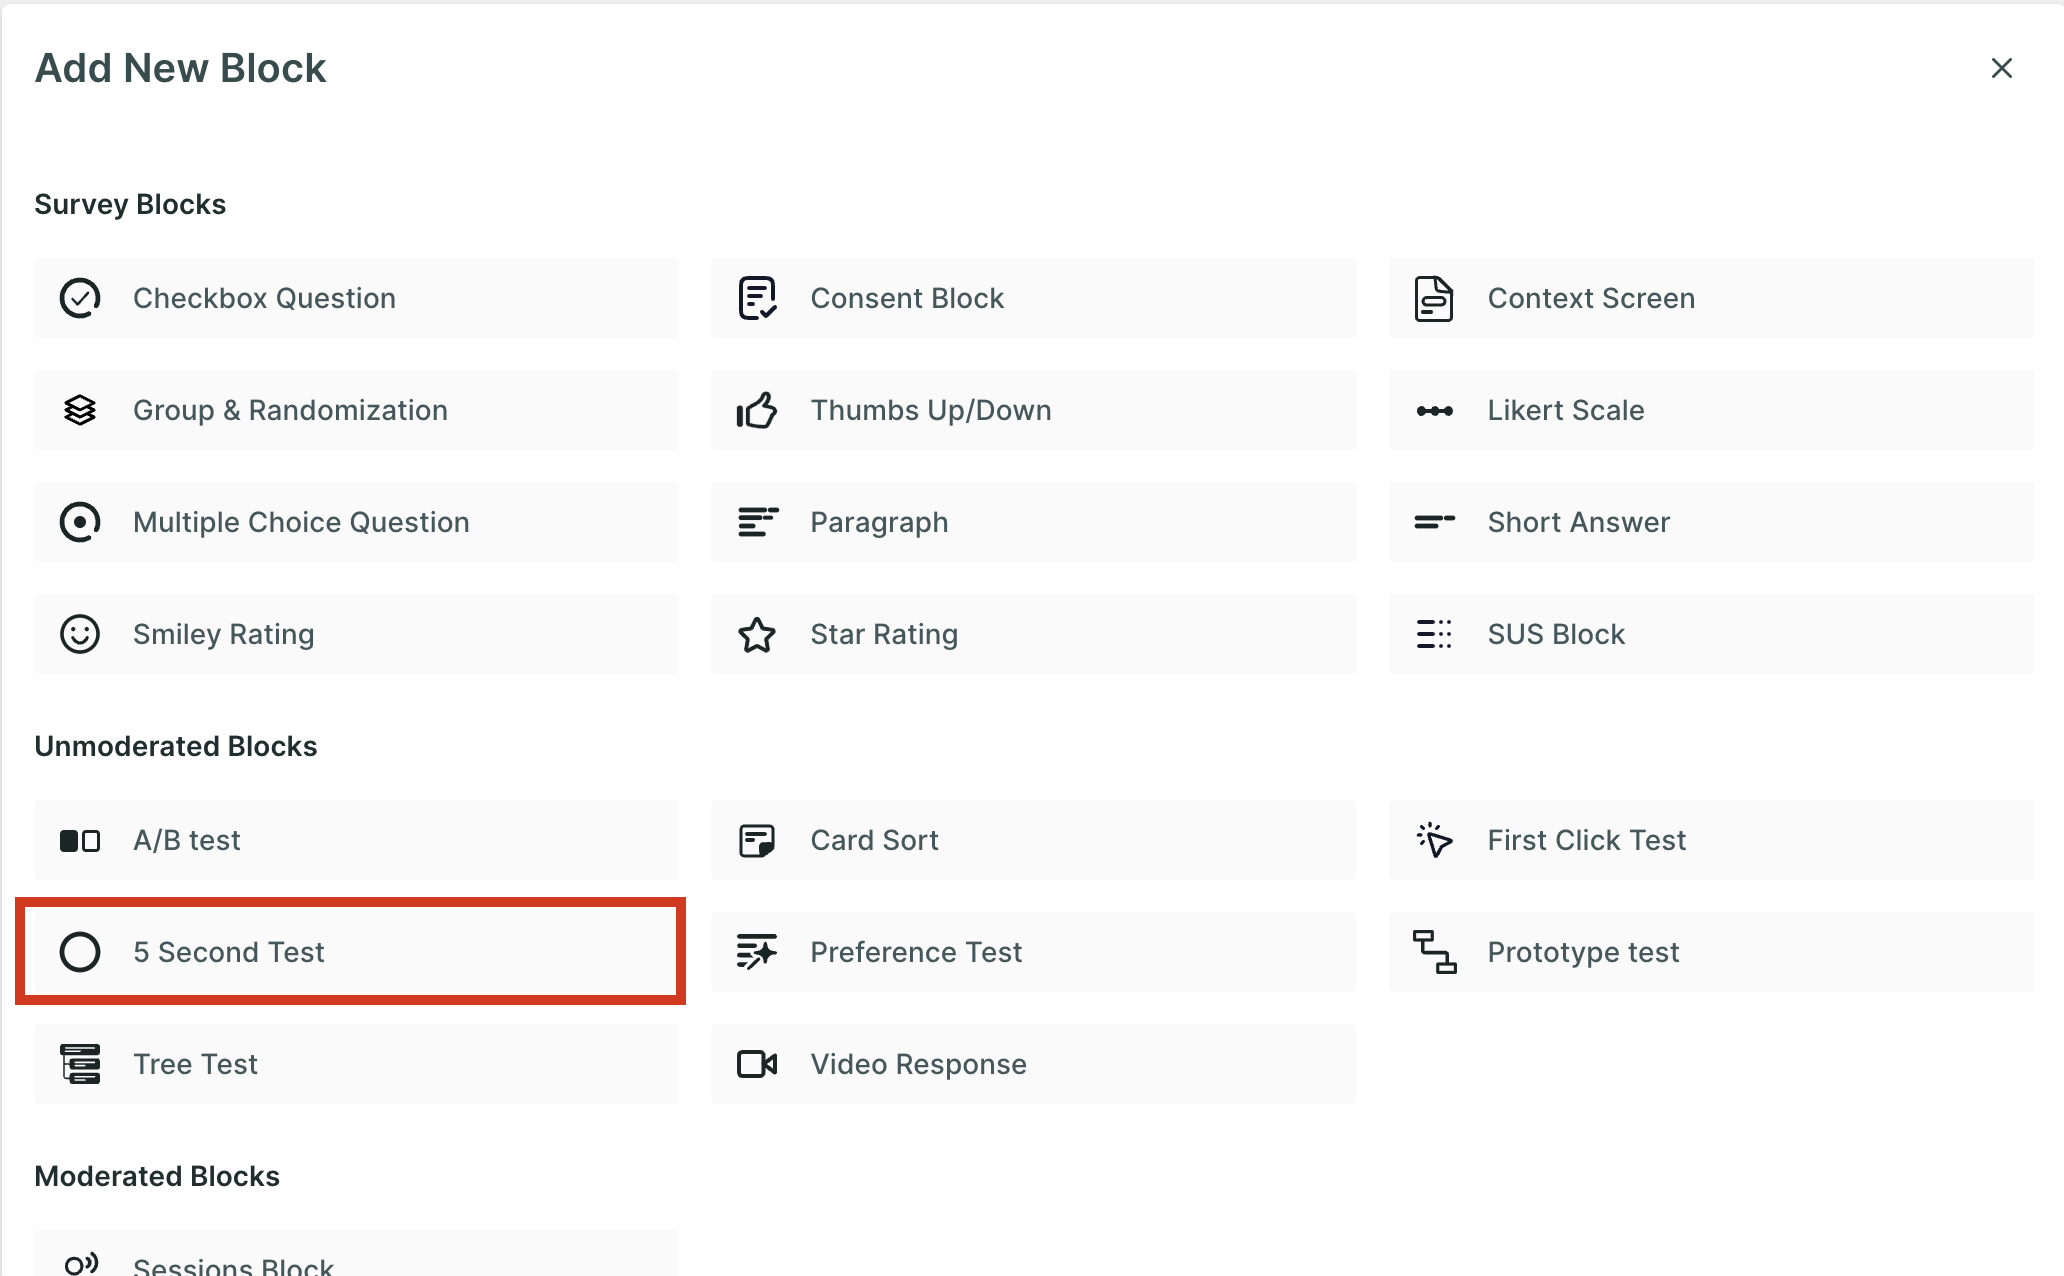
Step 2: Once you're in the study creation interface, locate the "+" button and click on it to add a new block. From the list of options that appear, select the "5-second test".
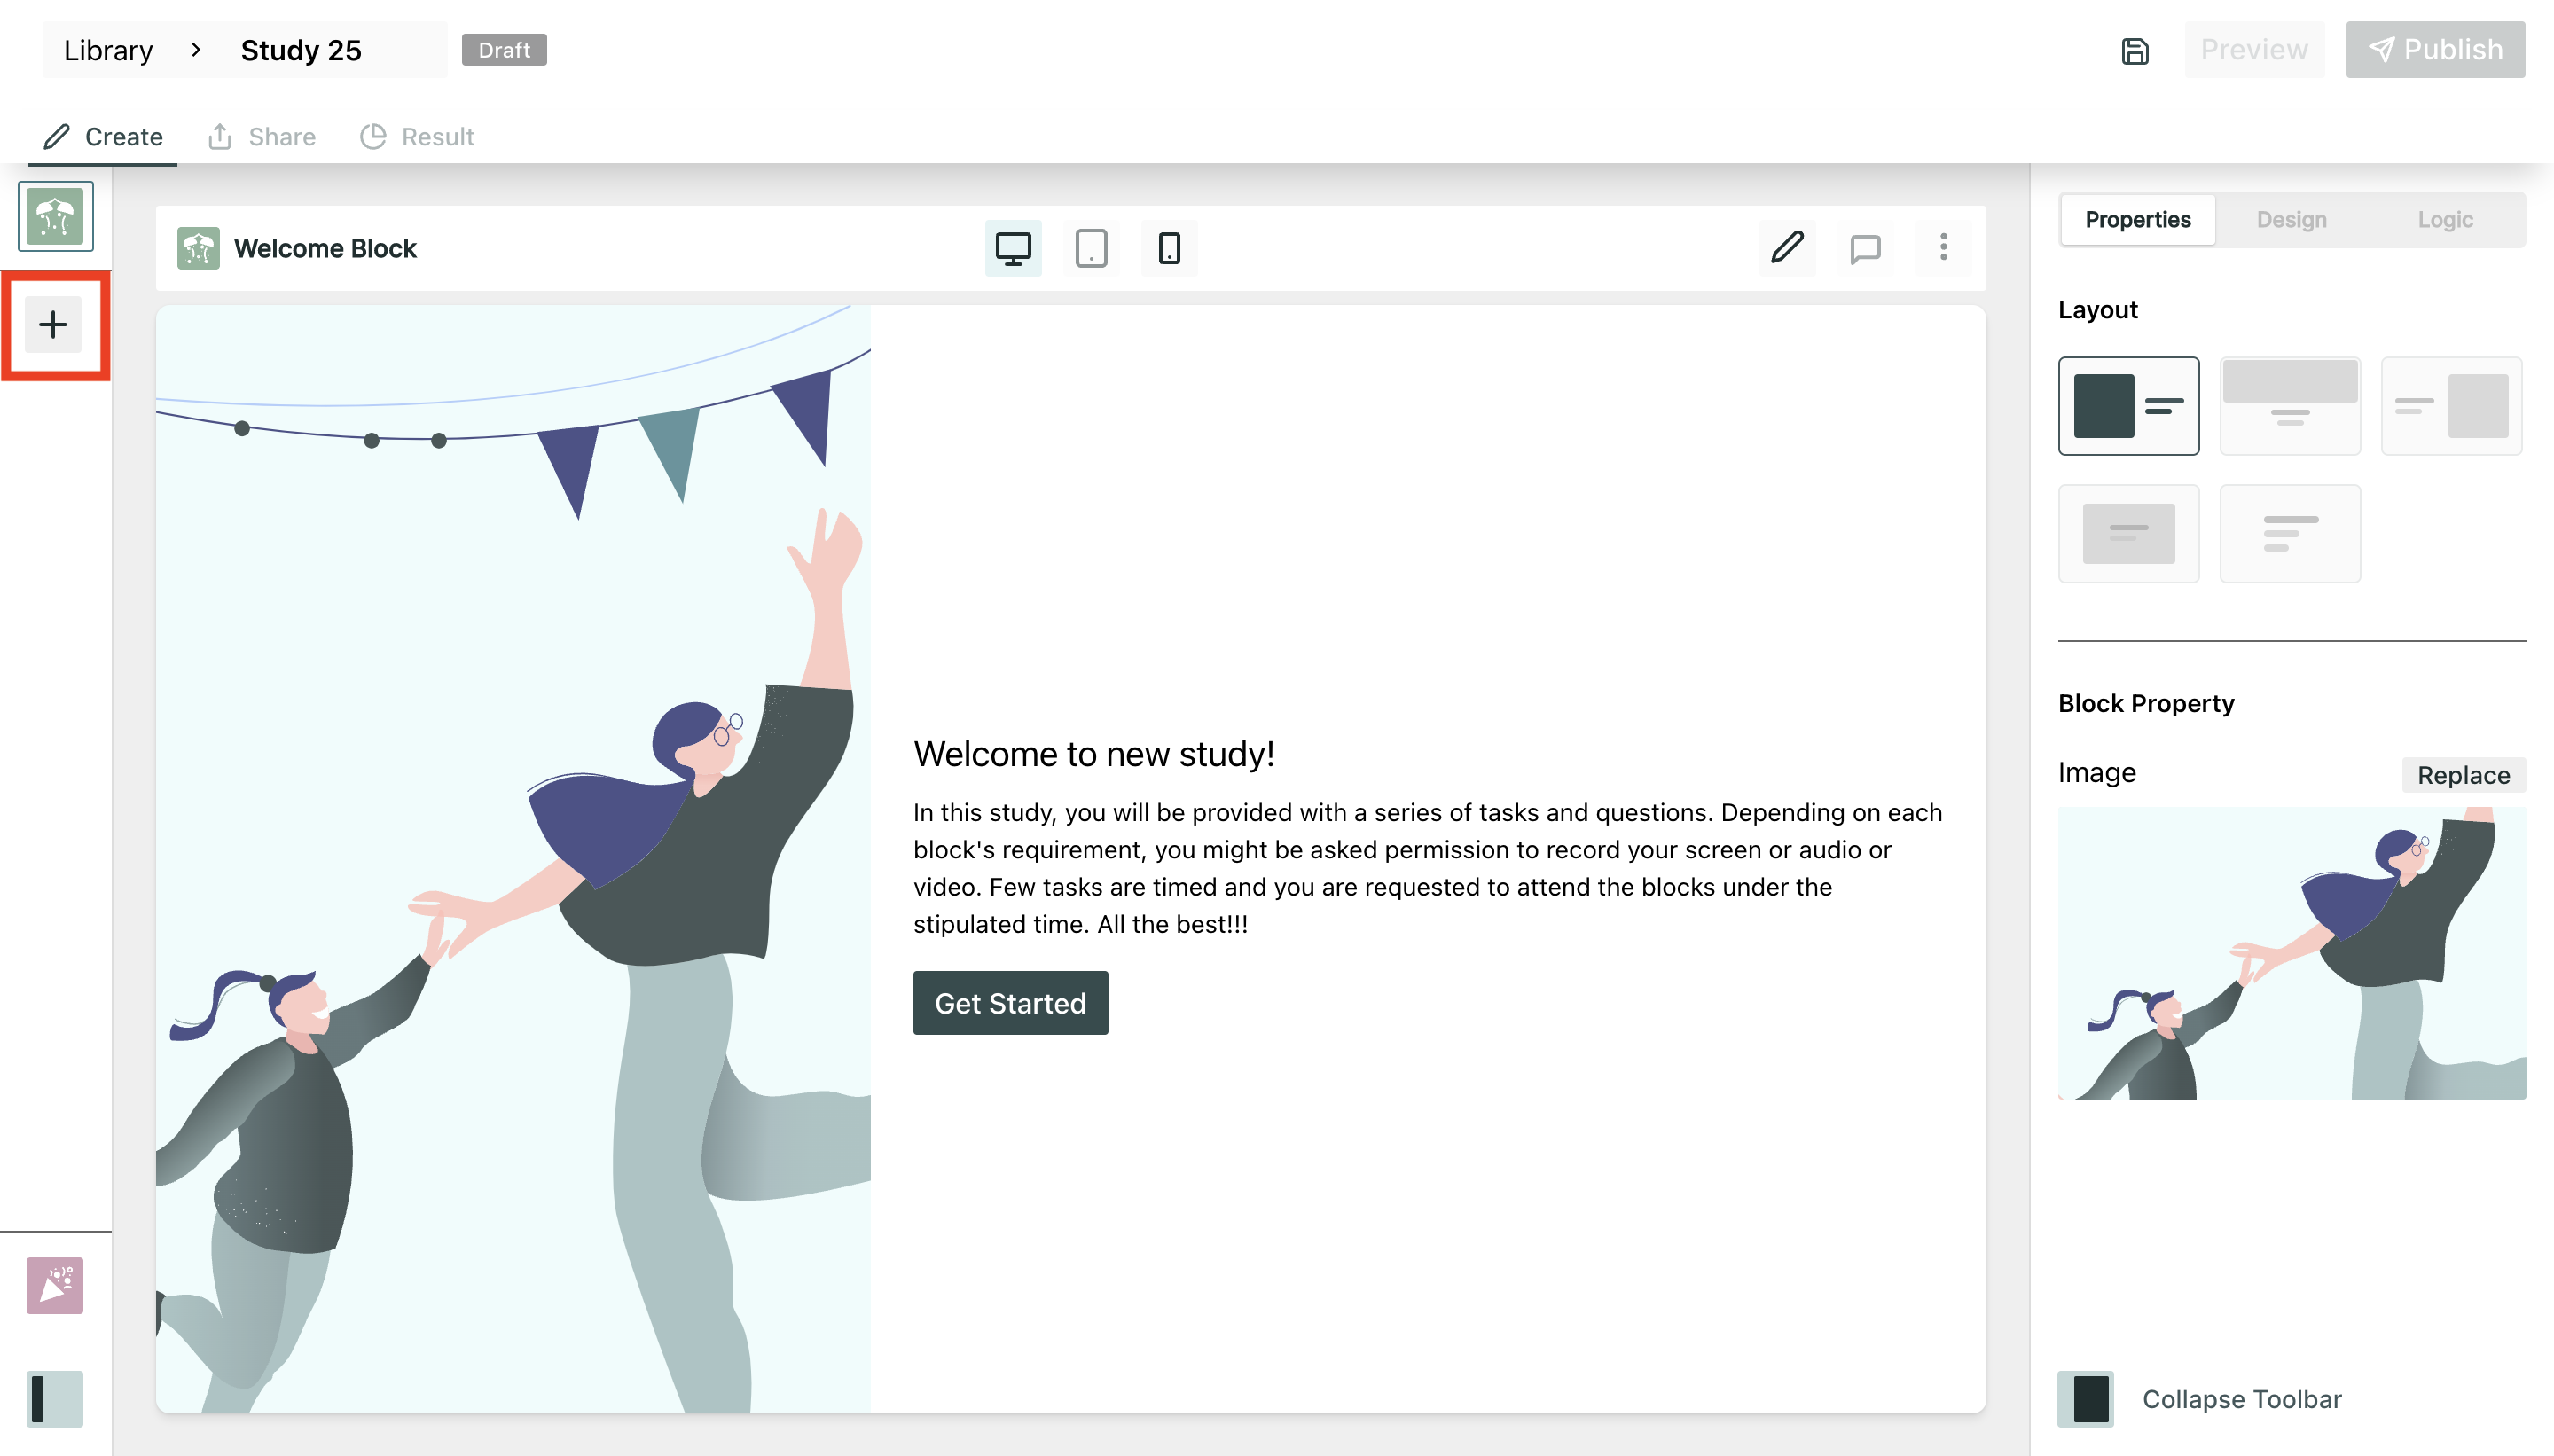
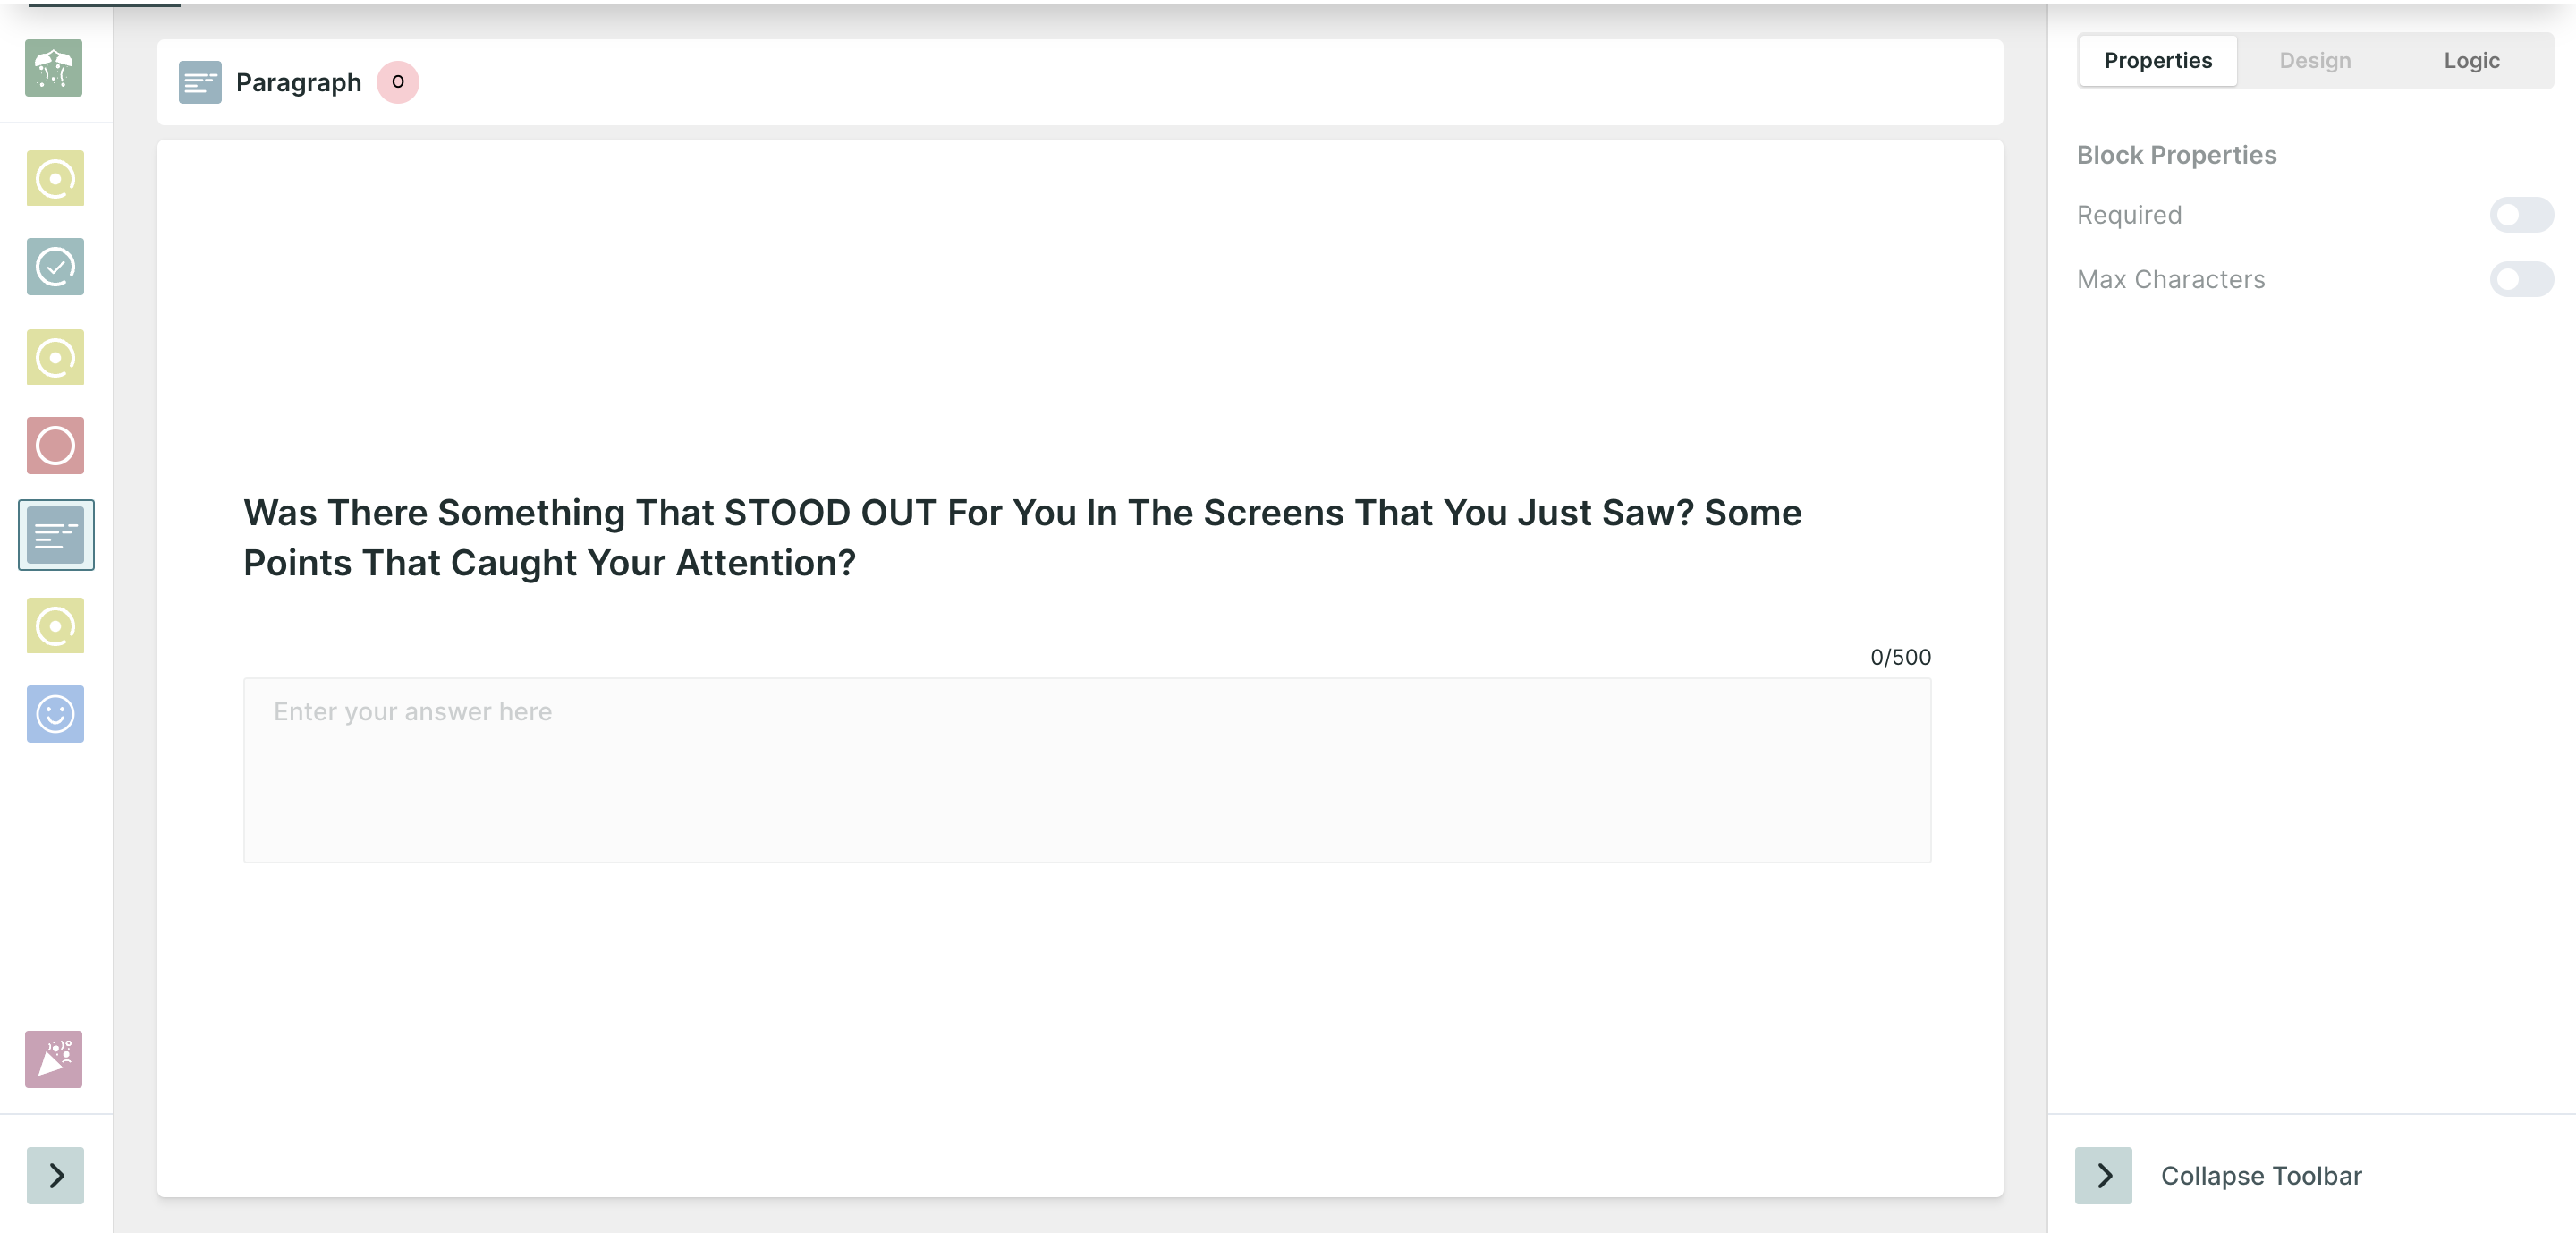
Step 3: To further enhance your study, continue adding additional survey blocks. Utilize the same process described in Step 2, clicking on the "+" button and selecting different block types to ask a variety of questions related to the test.
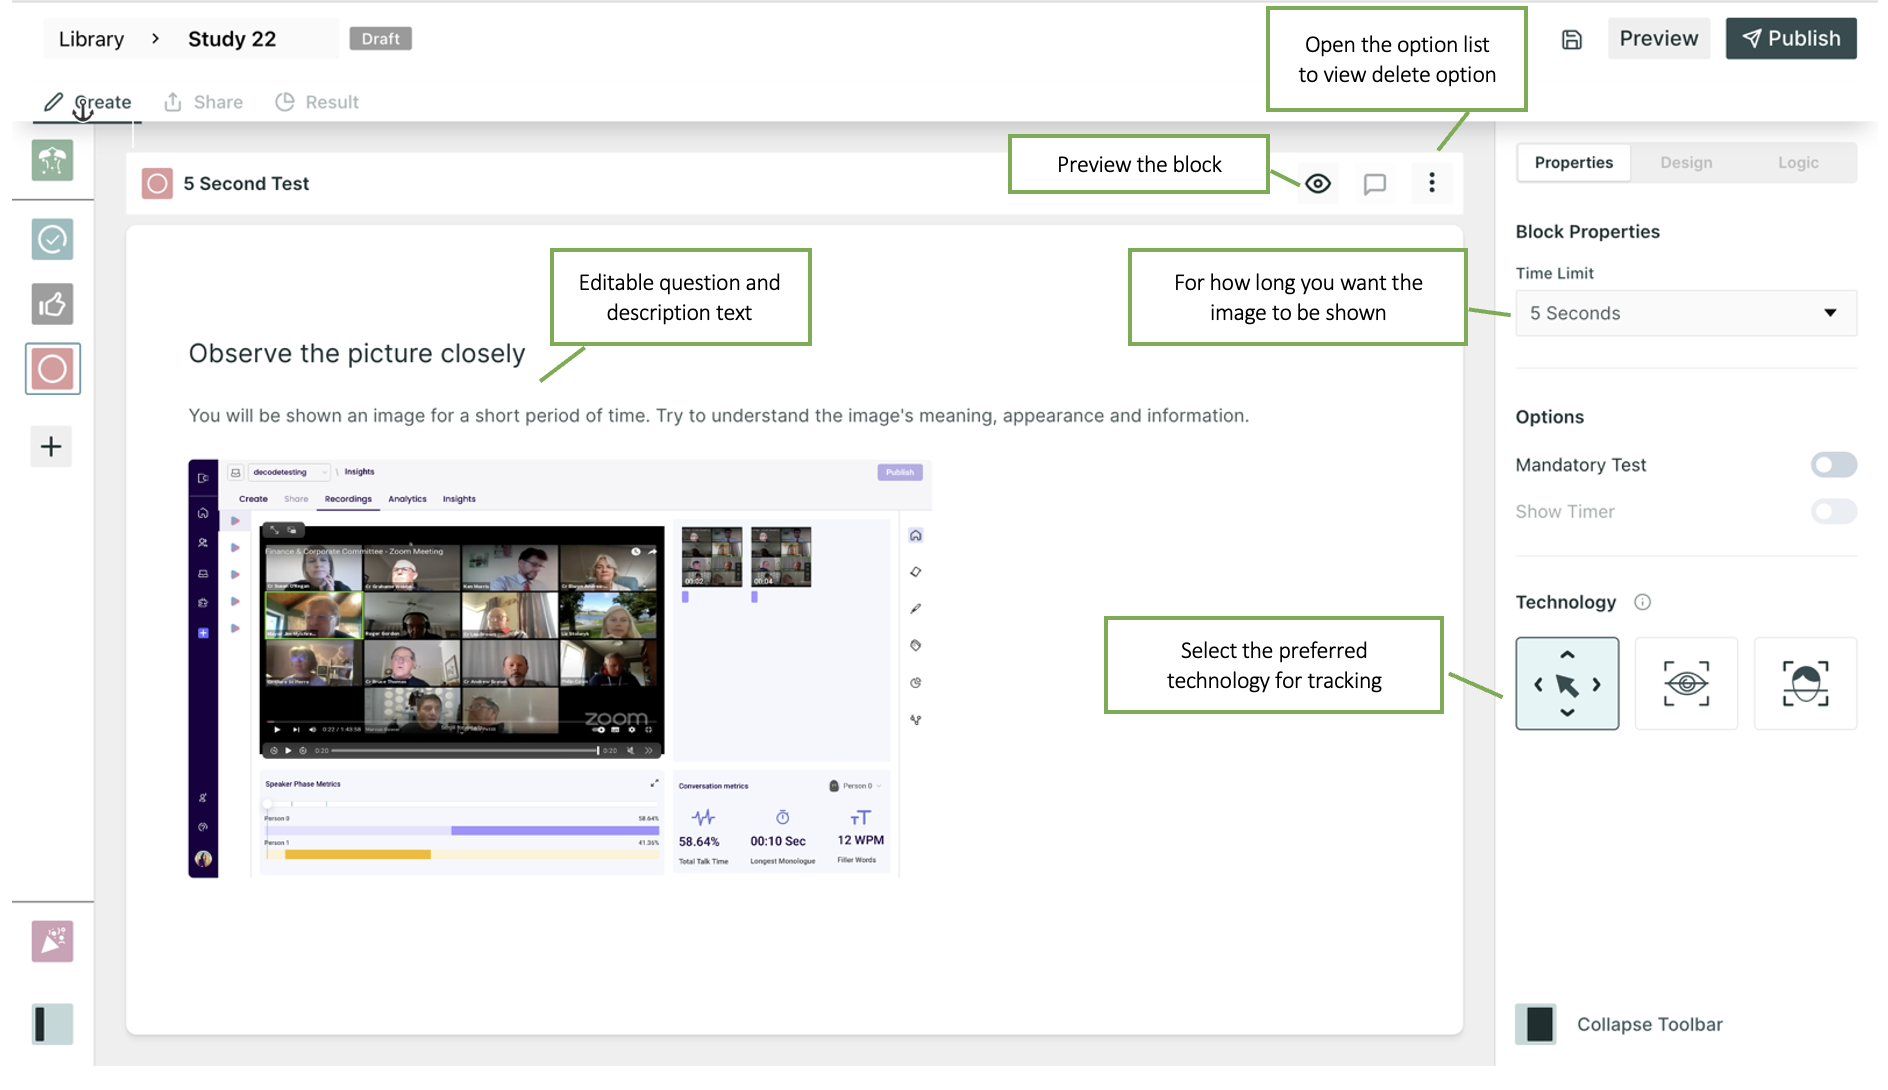
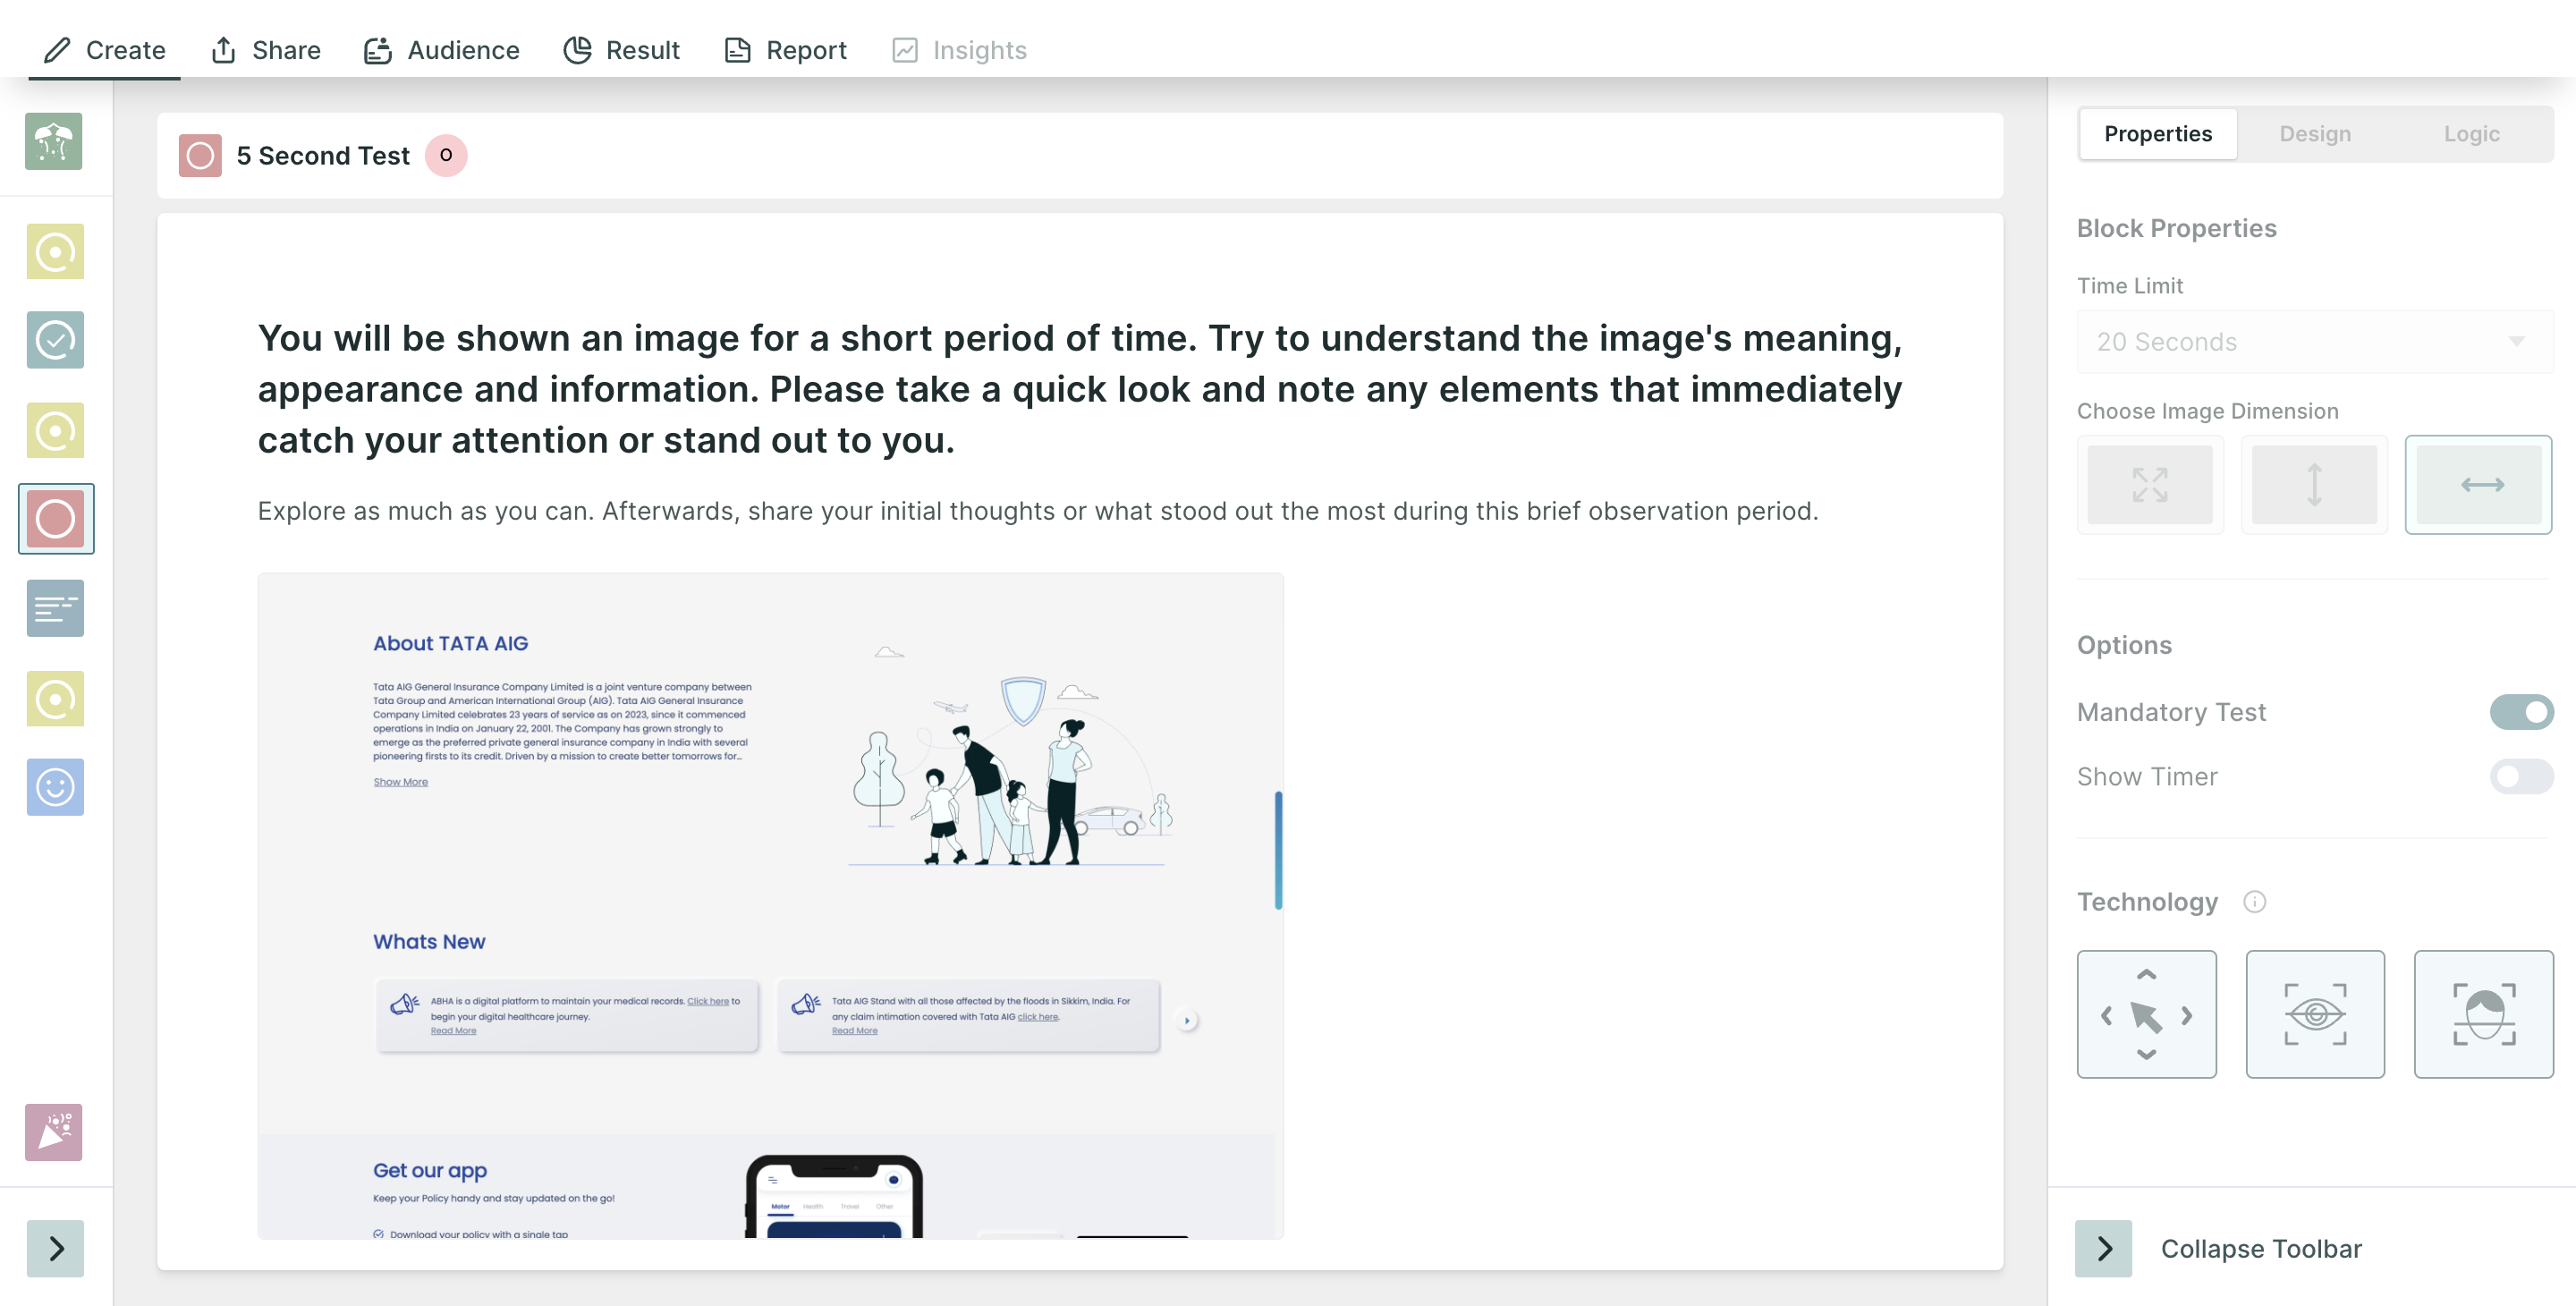
Properties
- Mandatory Test: Taking this test is mandatory; the respondent will not be able to move to another question without taking this test.
- Image Dimension:
- Fit to Screen: In this setting, the image is displayed in such a way that it completely fits within the boundaries of the screen, regardless of its original dimensions. Users can view the entire image without the need to scroll vertically or horizontally.
- Fit to Width: The image is scaled to cover the full width of the screen while maintaining its original aspect ratio. If the dimensions of the image exceed the width of the screen, users can scroll vertically to view the portions of the image that extend beyond the visible area.
- Fit to Height: In this configuration, the height of the image is adjusted to fit the screen while preserving its original width. If the width of the image exceeds the screen width, users can scroll horizontally to explore the entire image.
- Time Limit: You can change the time limit of the test to 10, 15 or 20 seconds using this option.
Technology
- Mouse Tracking: Mouse tracking is a technology that records the movement of the user's cursor on the screen as they interact with the design. This technology can provide insights into how users navigate through the design.
- Eye tracking: Eye tracking is a technology that records the movement of the user's eyes as they interact with the design. This technology can provide insights into which elements of the design users are looking for, which areas are most engaging, and which areas may need improvement.
- Facial Coding: Facial coding is a technology that is used to analyze users' facial expressions as they interact with the design. This technology can provide insights into users' emotional responses to the product. It can be used to optimize the product's design and messaging to elicit more positive emotional responses from users.
To select the technologies, click on the boxes.
You can select more than one tracking technology at once too.
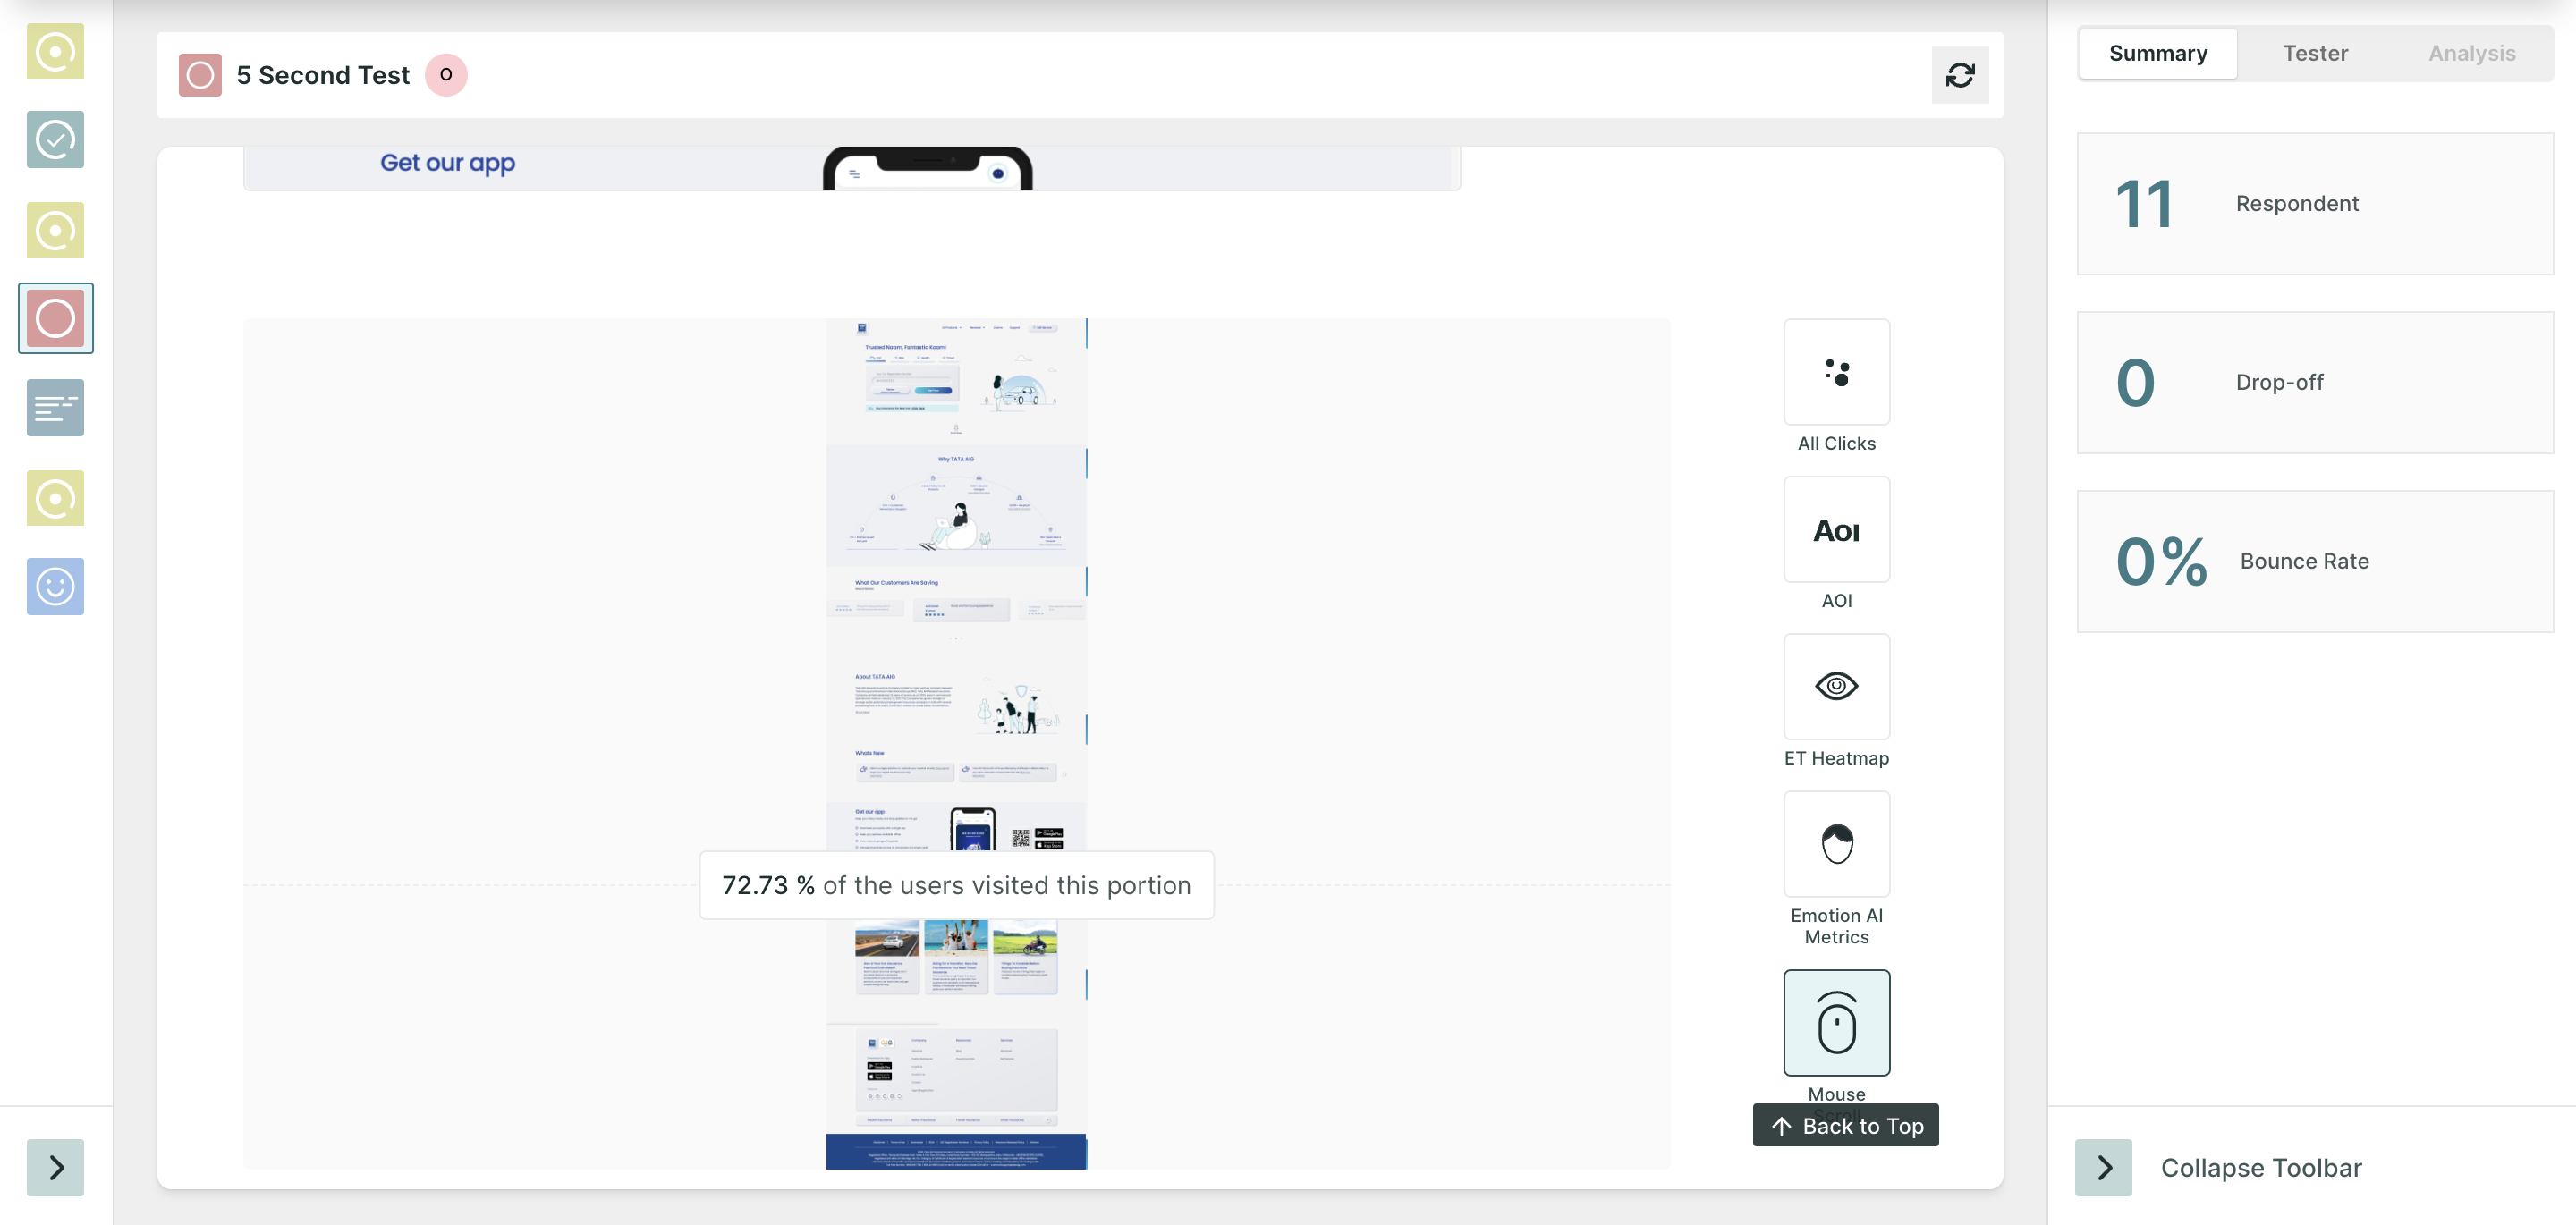
Result View 📊
Once the respondents have taken the test, you will be able to see the analytics in the result section.
In the summary section, you will find the following information:
- Respondents: Number of people who initiated the test block.
- Skip: The Number of people who choose to skip the block.
- Drop-off: Number of people who have not moved on to the next block.
- Bounce Rate: ((Dropoff + Skip)/ Number of Responses)*100 . (In Percentage)
Based on the technology selected, you will find the following metrics :
- All clicks: All Clicks metrics provide insights on the clicks made by the respondents on the image. It gives a complete view of how users interact with the image. The size of a click depends on how many times respondents have clicked in that area. This helps us understand which parts of the picture are getting more attention from users.
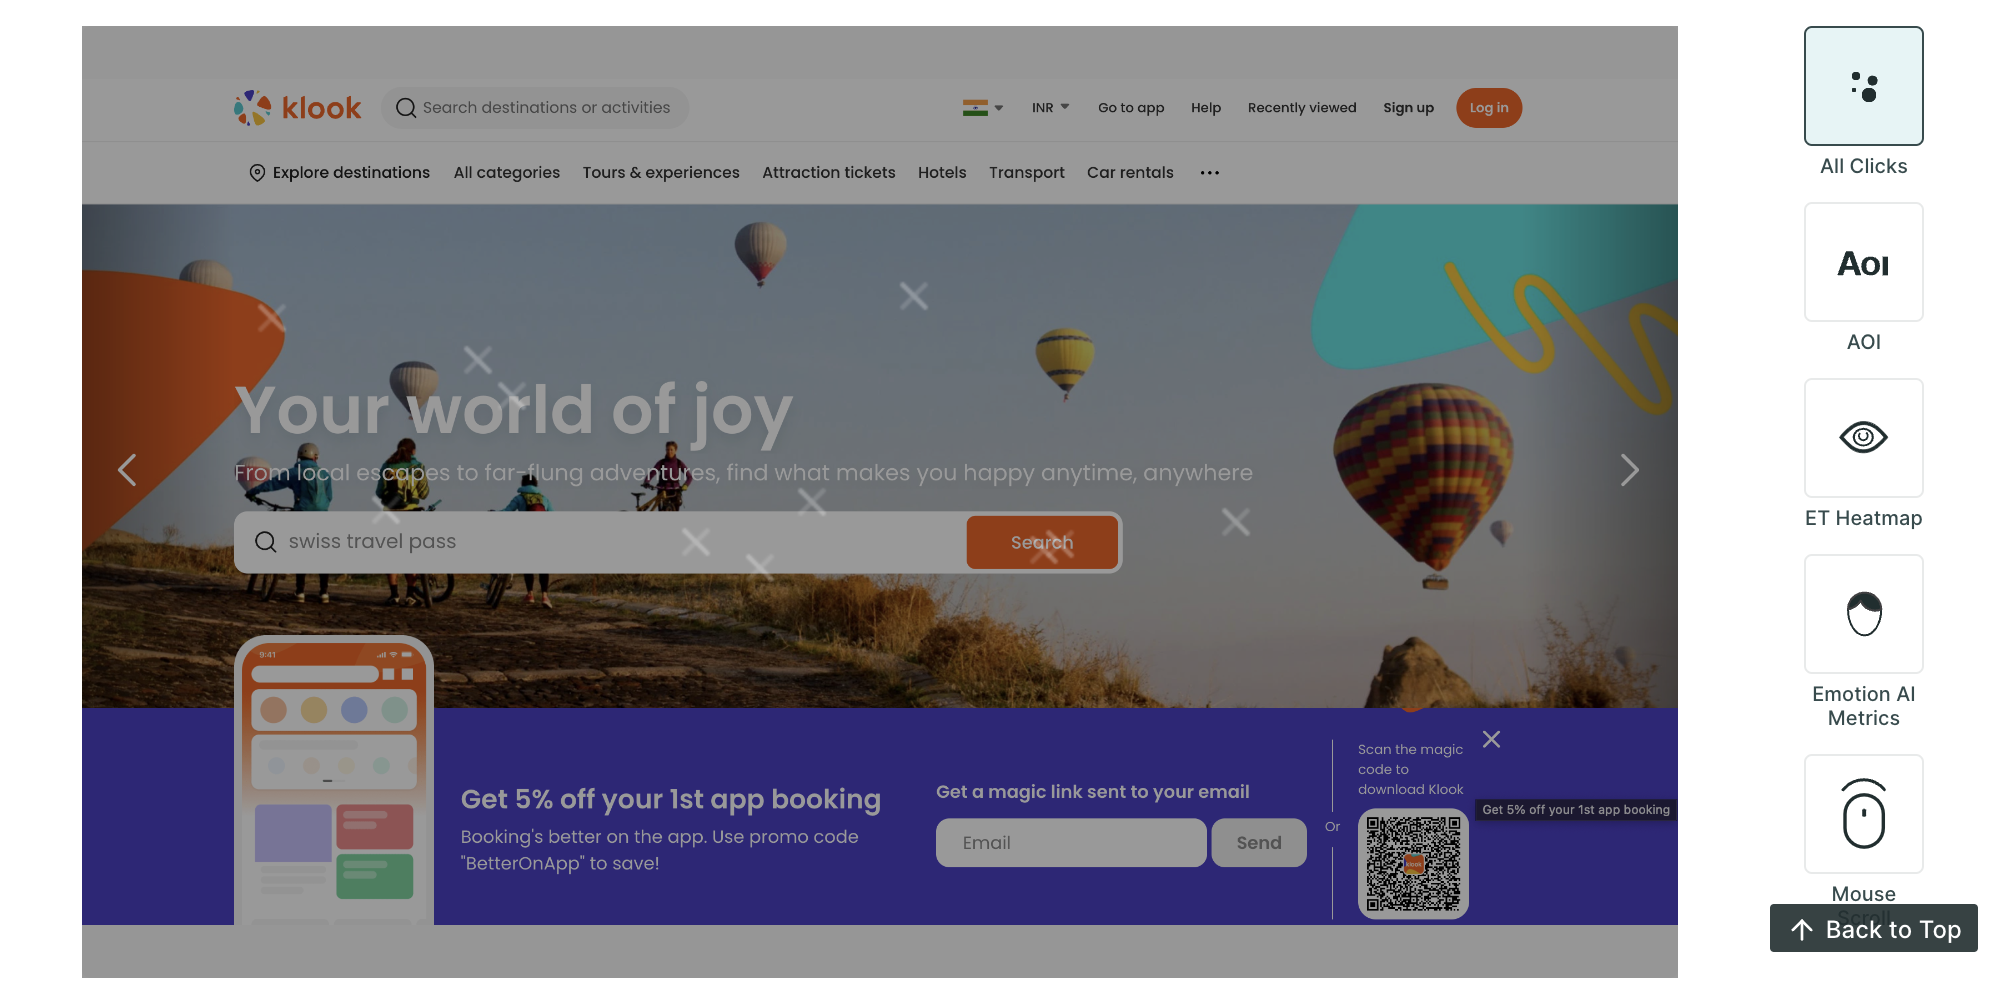
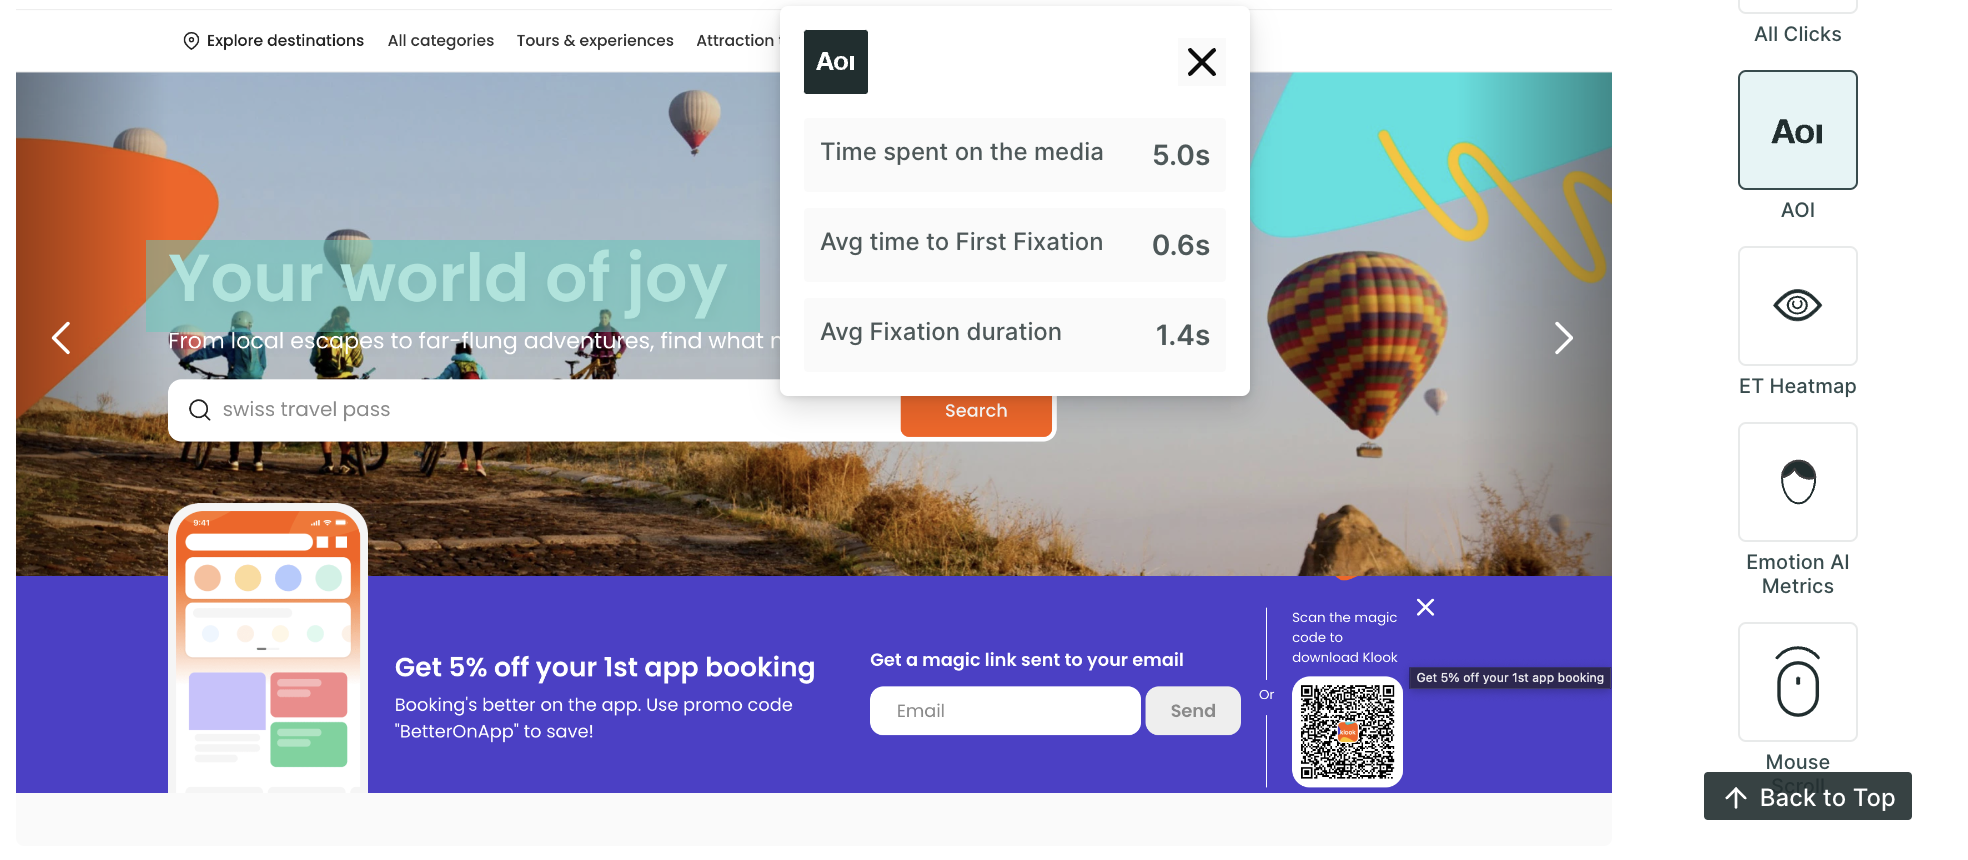
- AOI (Area of Interest): On the image, you can create AOIs. Within AOIs, you can glean insights into metrics such as time spent, average time to first fixation, and average fixation duration providing a deeper understanding of user engagement.
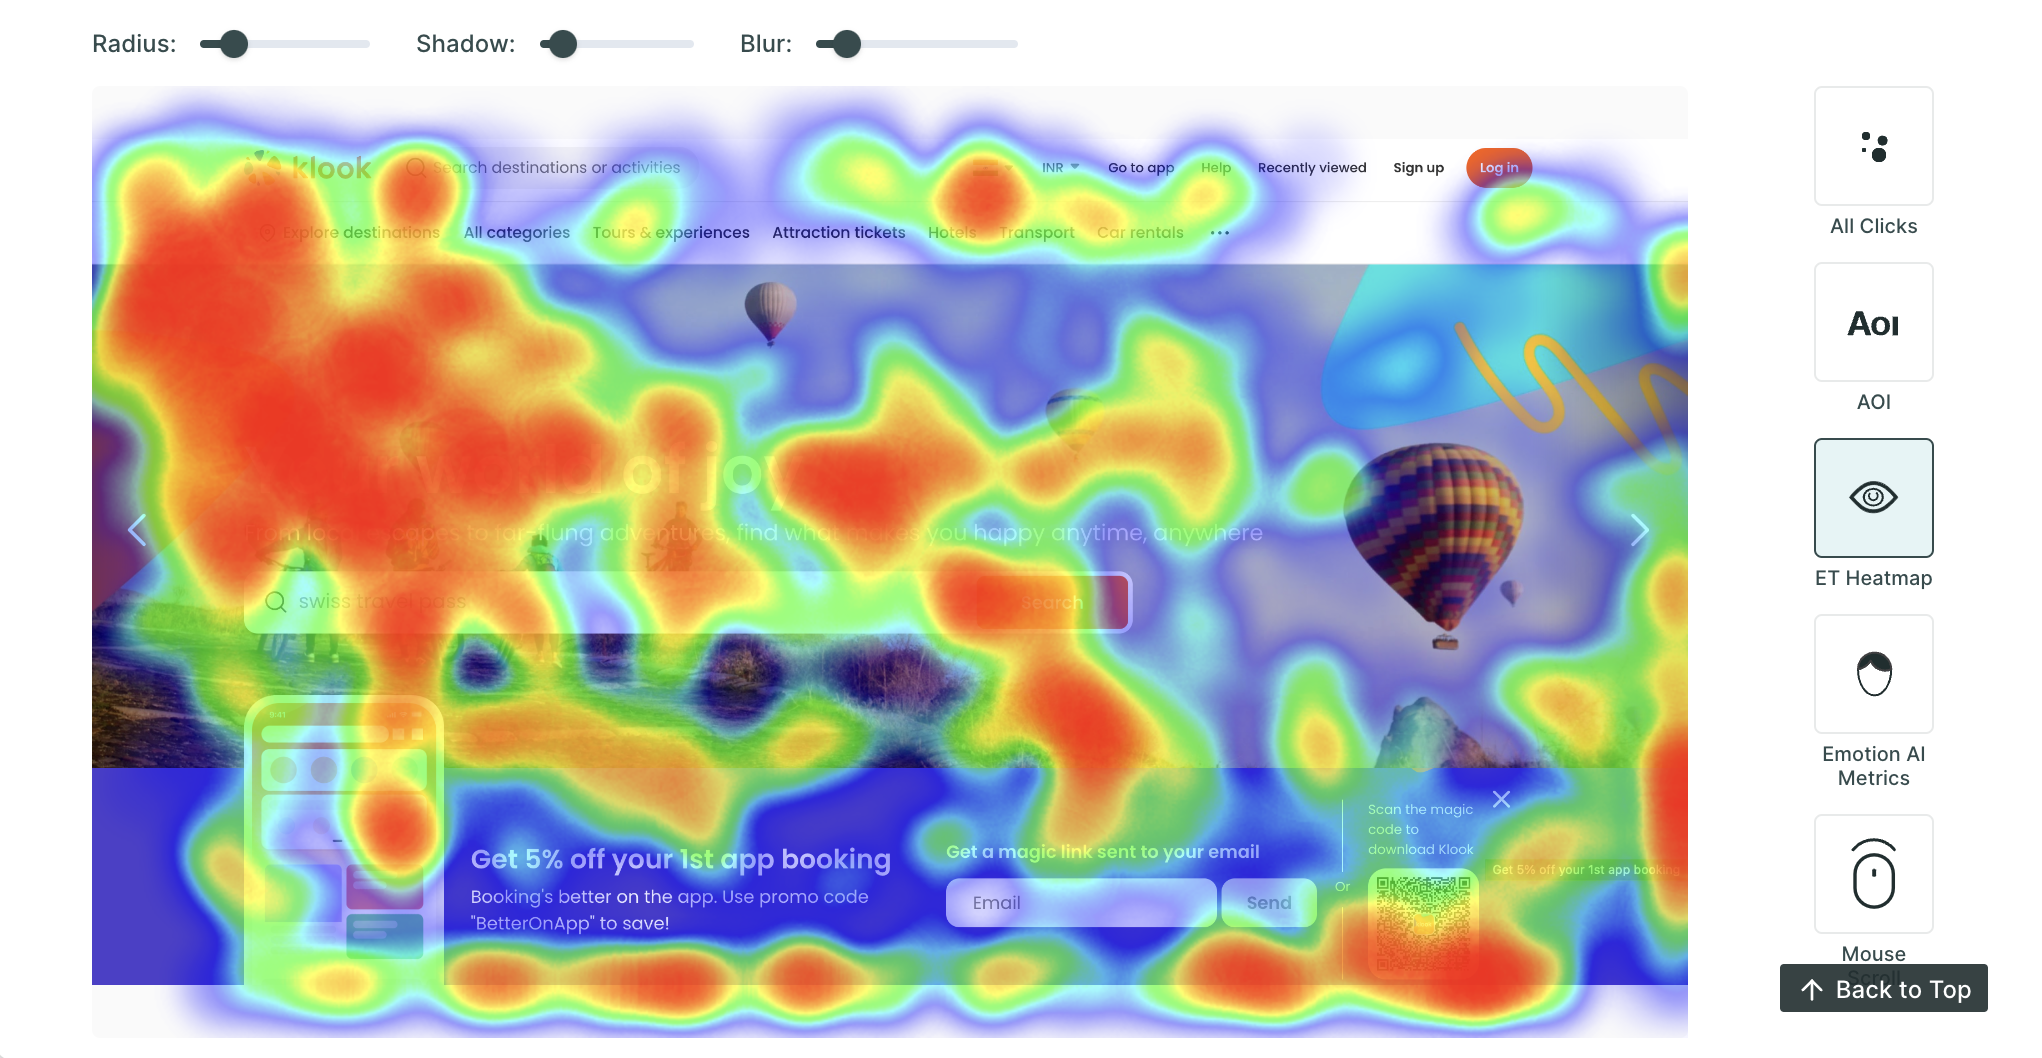
- ET Heatmap: An eye-tracking heatmap is a visual representation of where people look on a page. It is created by tracking the eye movements of users as they interact with the image. The heatmap then shows the areas of the screen that received the most attention, with the hottest areas being those that were looked at the most.
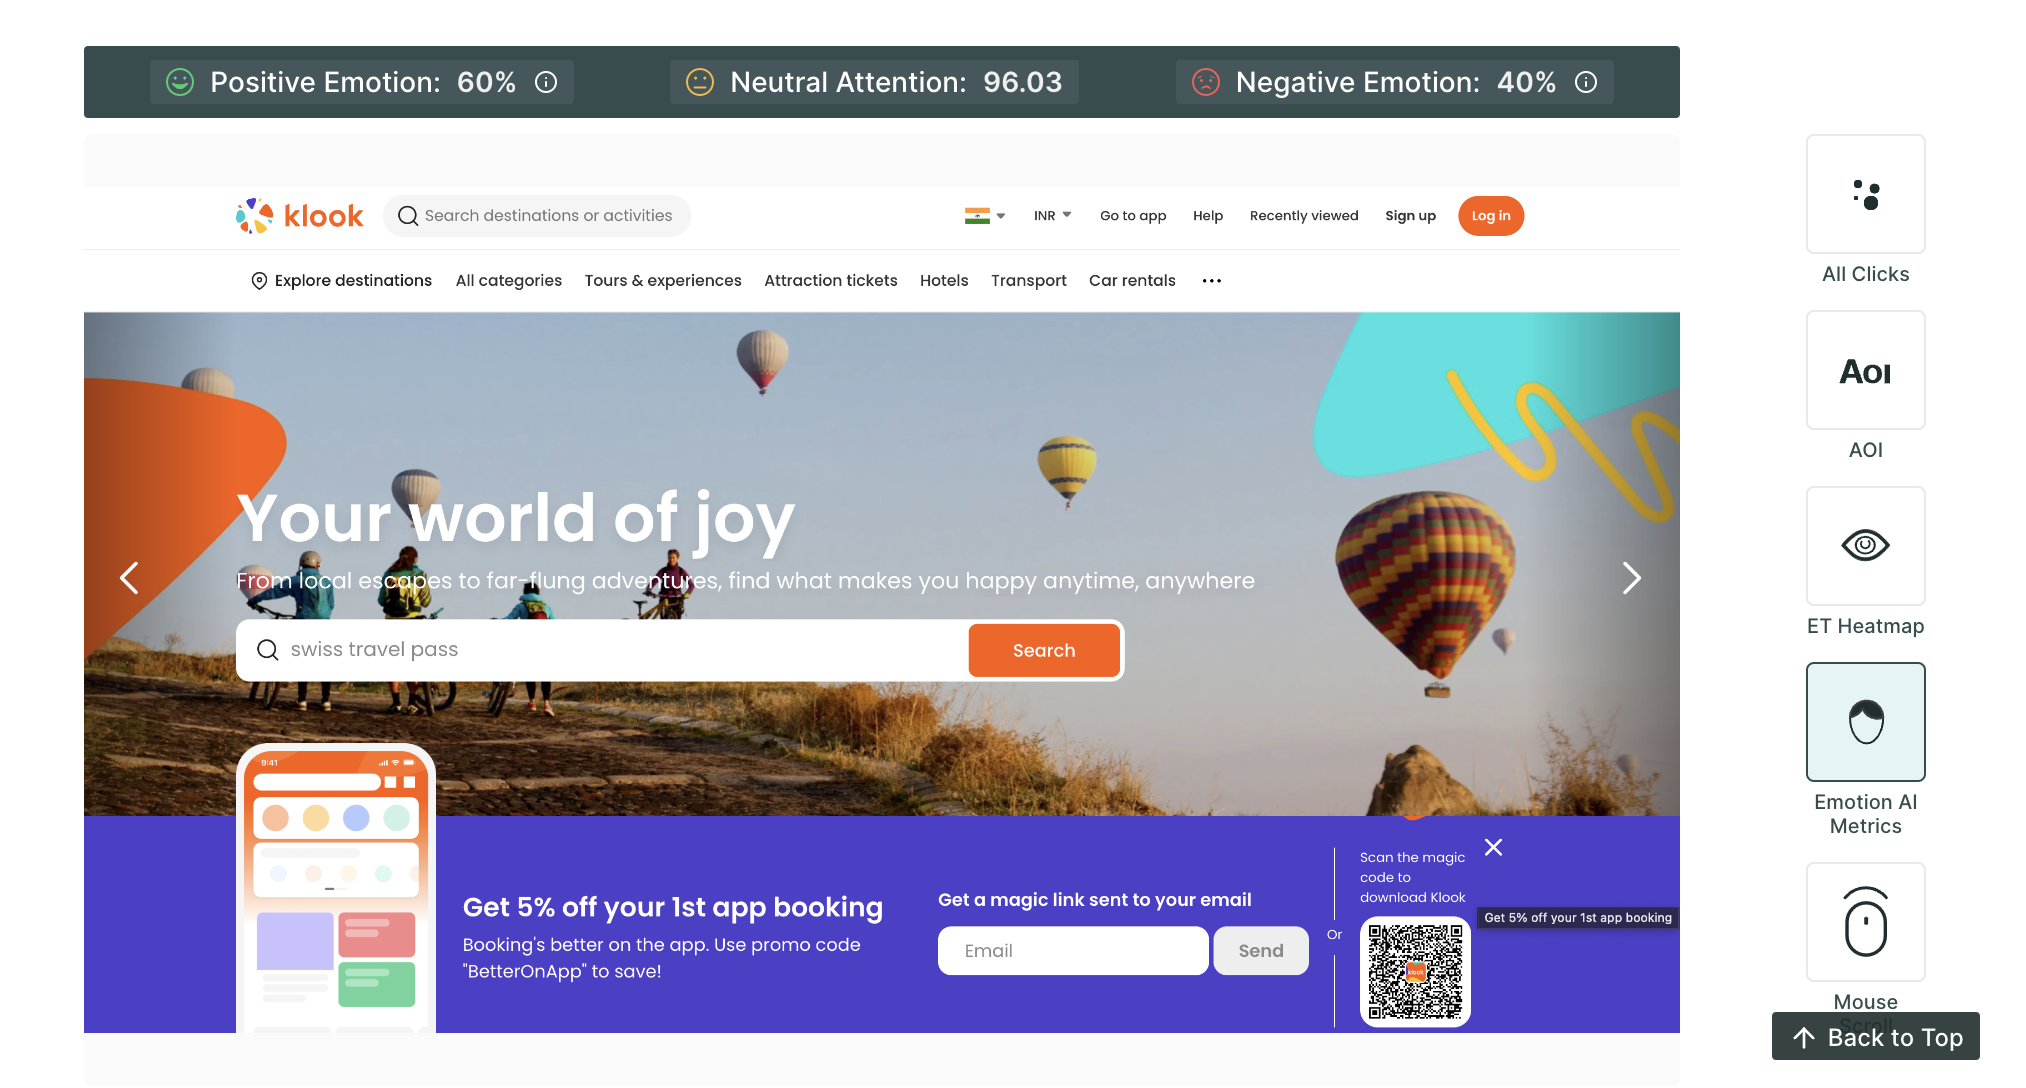
- Emotion AI Metrics: Dive into the emotional resonance of your content with metrics that categorize user responses as neutral, positive, or negative, allowing you to gauge the emotional impact of your design or content.
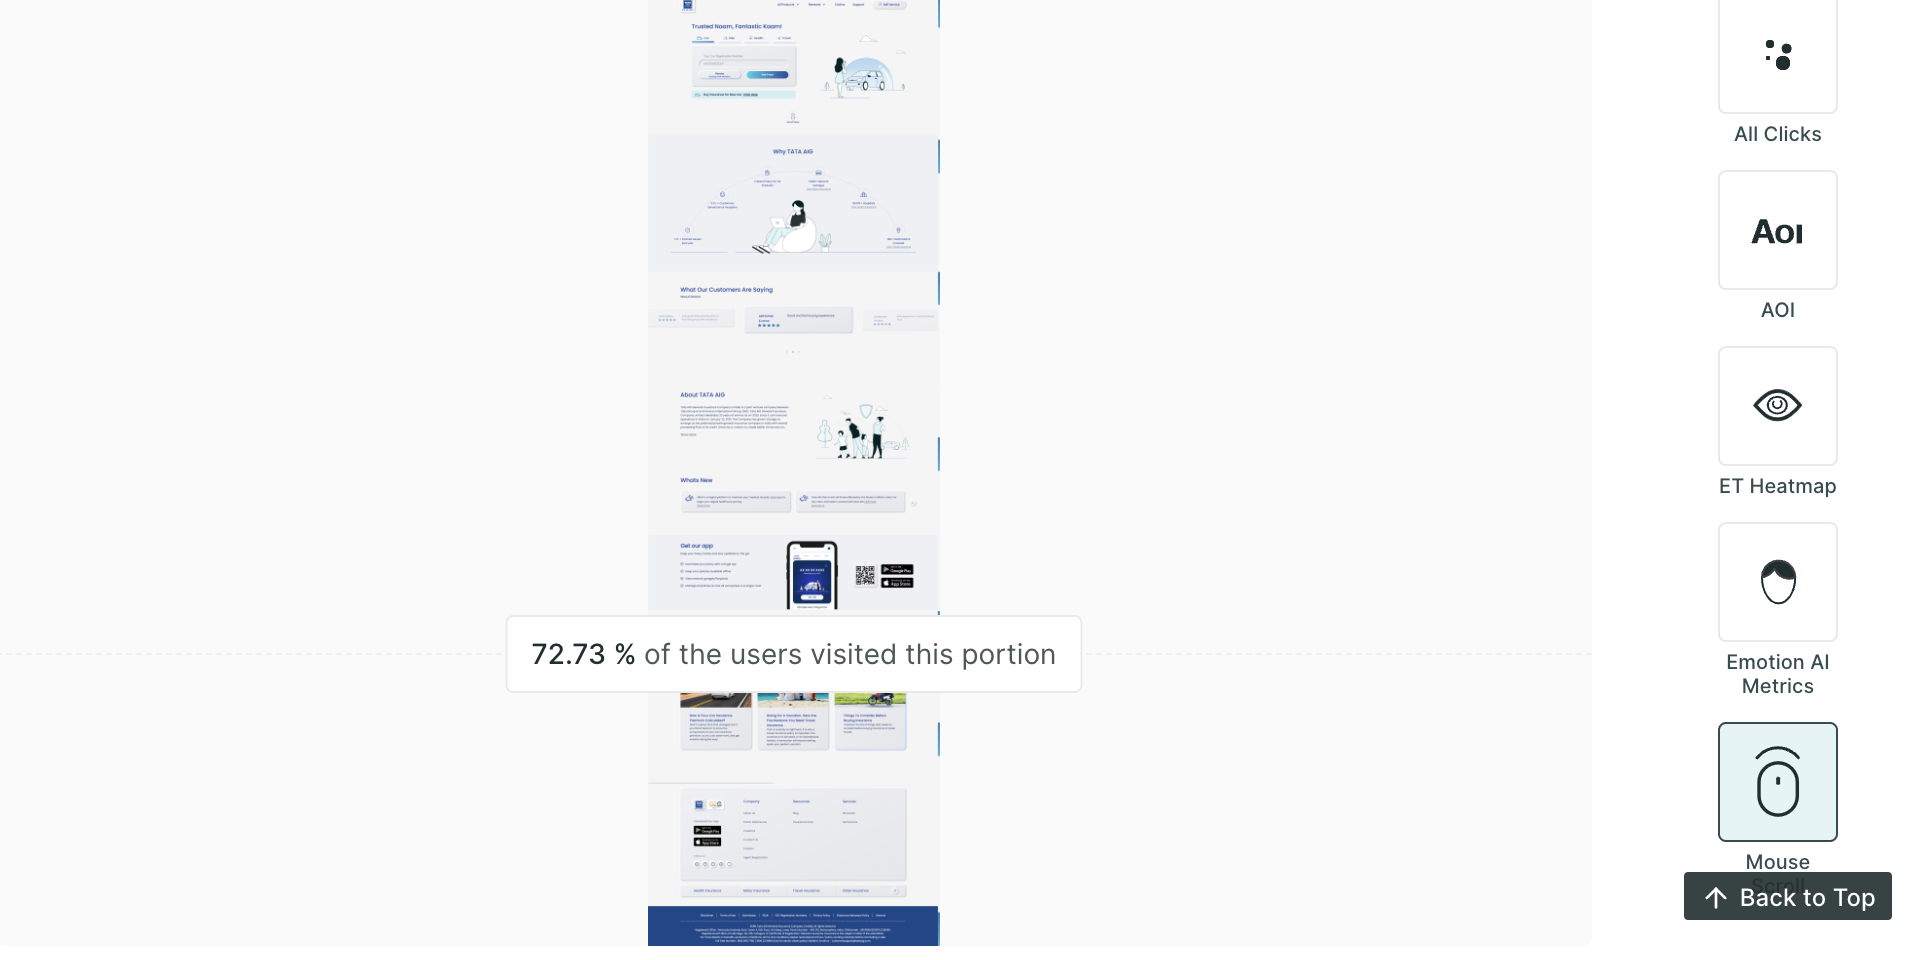
- Mouse Scroll Data: This metric provides valuable insights into how users navigate a scrollable page by revealing the extent of the page they have visited. This metric helps us understand the user's engagement and attention as they scroll through the content, offering valuable information about which areas of the page are being explored.
Example
Here is an example of how you can use Qatalyst for 5-second testing:
Suppose you are a designer working on a new landing page for a website. You want to use 5-second testing to get feedback on the visual appeal and memorability of the landing page design.
You decide to run a five-second test and ask participants if they are able to understand what the company does by looking at the landing page or if the message is clearly speaking to the audience or not.
Step 1: Upload the Image
After determining the focus of your test, you can proceed to configure your test within Qatalyst. This can be done by uploading an image of the specific screen you wish to test.
Qatalyst provides you with the ability to enable technologies like eye tracking, facial coding, and mouse tracking. These technologies can be used to collect valuable data about how users interact with your website or design.
Step 2: Create Questions around the Test
Now, add questions to understand users' comprehension of the landing page and gauge their overall perception of the website. For this, use the survey blocks. Keep the questions concise and focused to gather quick, instinctive responses within the limited 5-second timeframe.
Step 3: Publish the test and share
Now that your test is ready, it’s time to share the test with the participants.
Step 4: Analyze the Result
After all, participants have completed the testing process. It is time to delve into the analytics and examine their responses to assess the success of your test.
In Qatalyst, you will separate the results for the question blocks added and the research blocks. If you have enabled the technology of tracking, you will get the metrics accordingly.
Five-second tests are a quick and effective exercise to measure the clarity of your design and how it communicates a message which can later help you improve the user experience of your design.