
A/B testing in Qatalyst
In Qatalyst, you can conduct A/B testing on images to determine which one users prefer. Additionally, we offer you the ability to integrate various technologies, such as mouse tracking, facial coding, and eye tracking, to gather additional data and insights about user behaviour and preferences.
Create an A/B Test👩🏻💻
To create an A/B test, follow these simple steps:
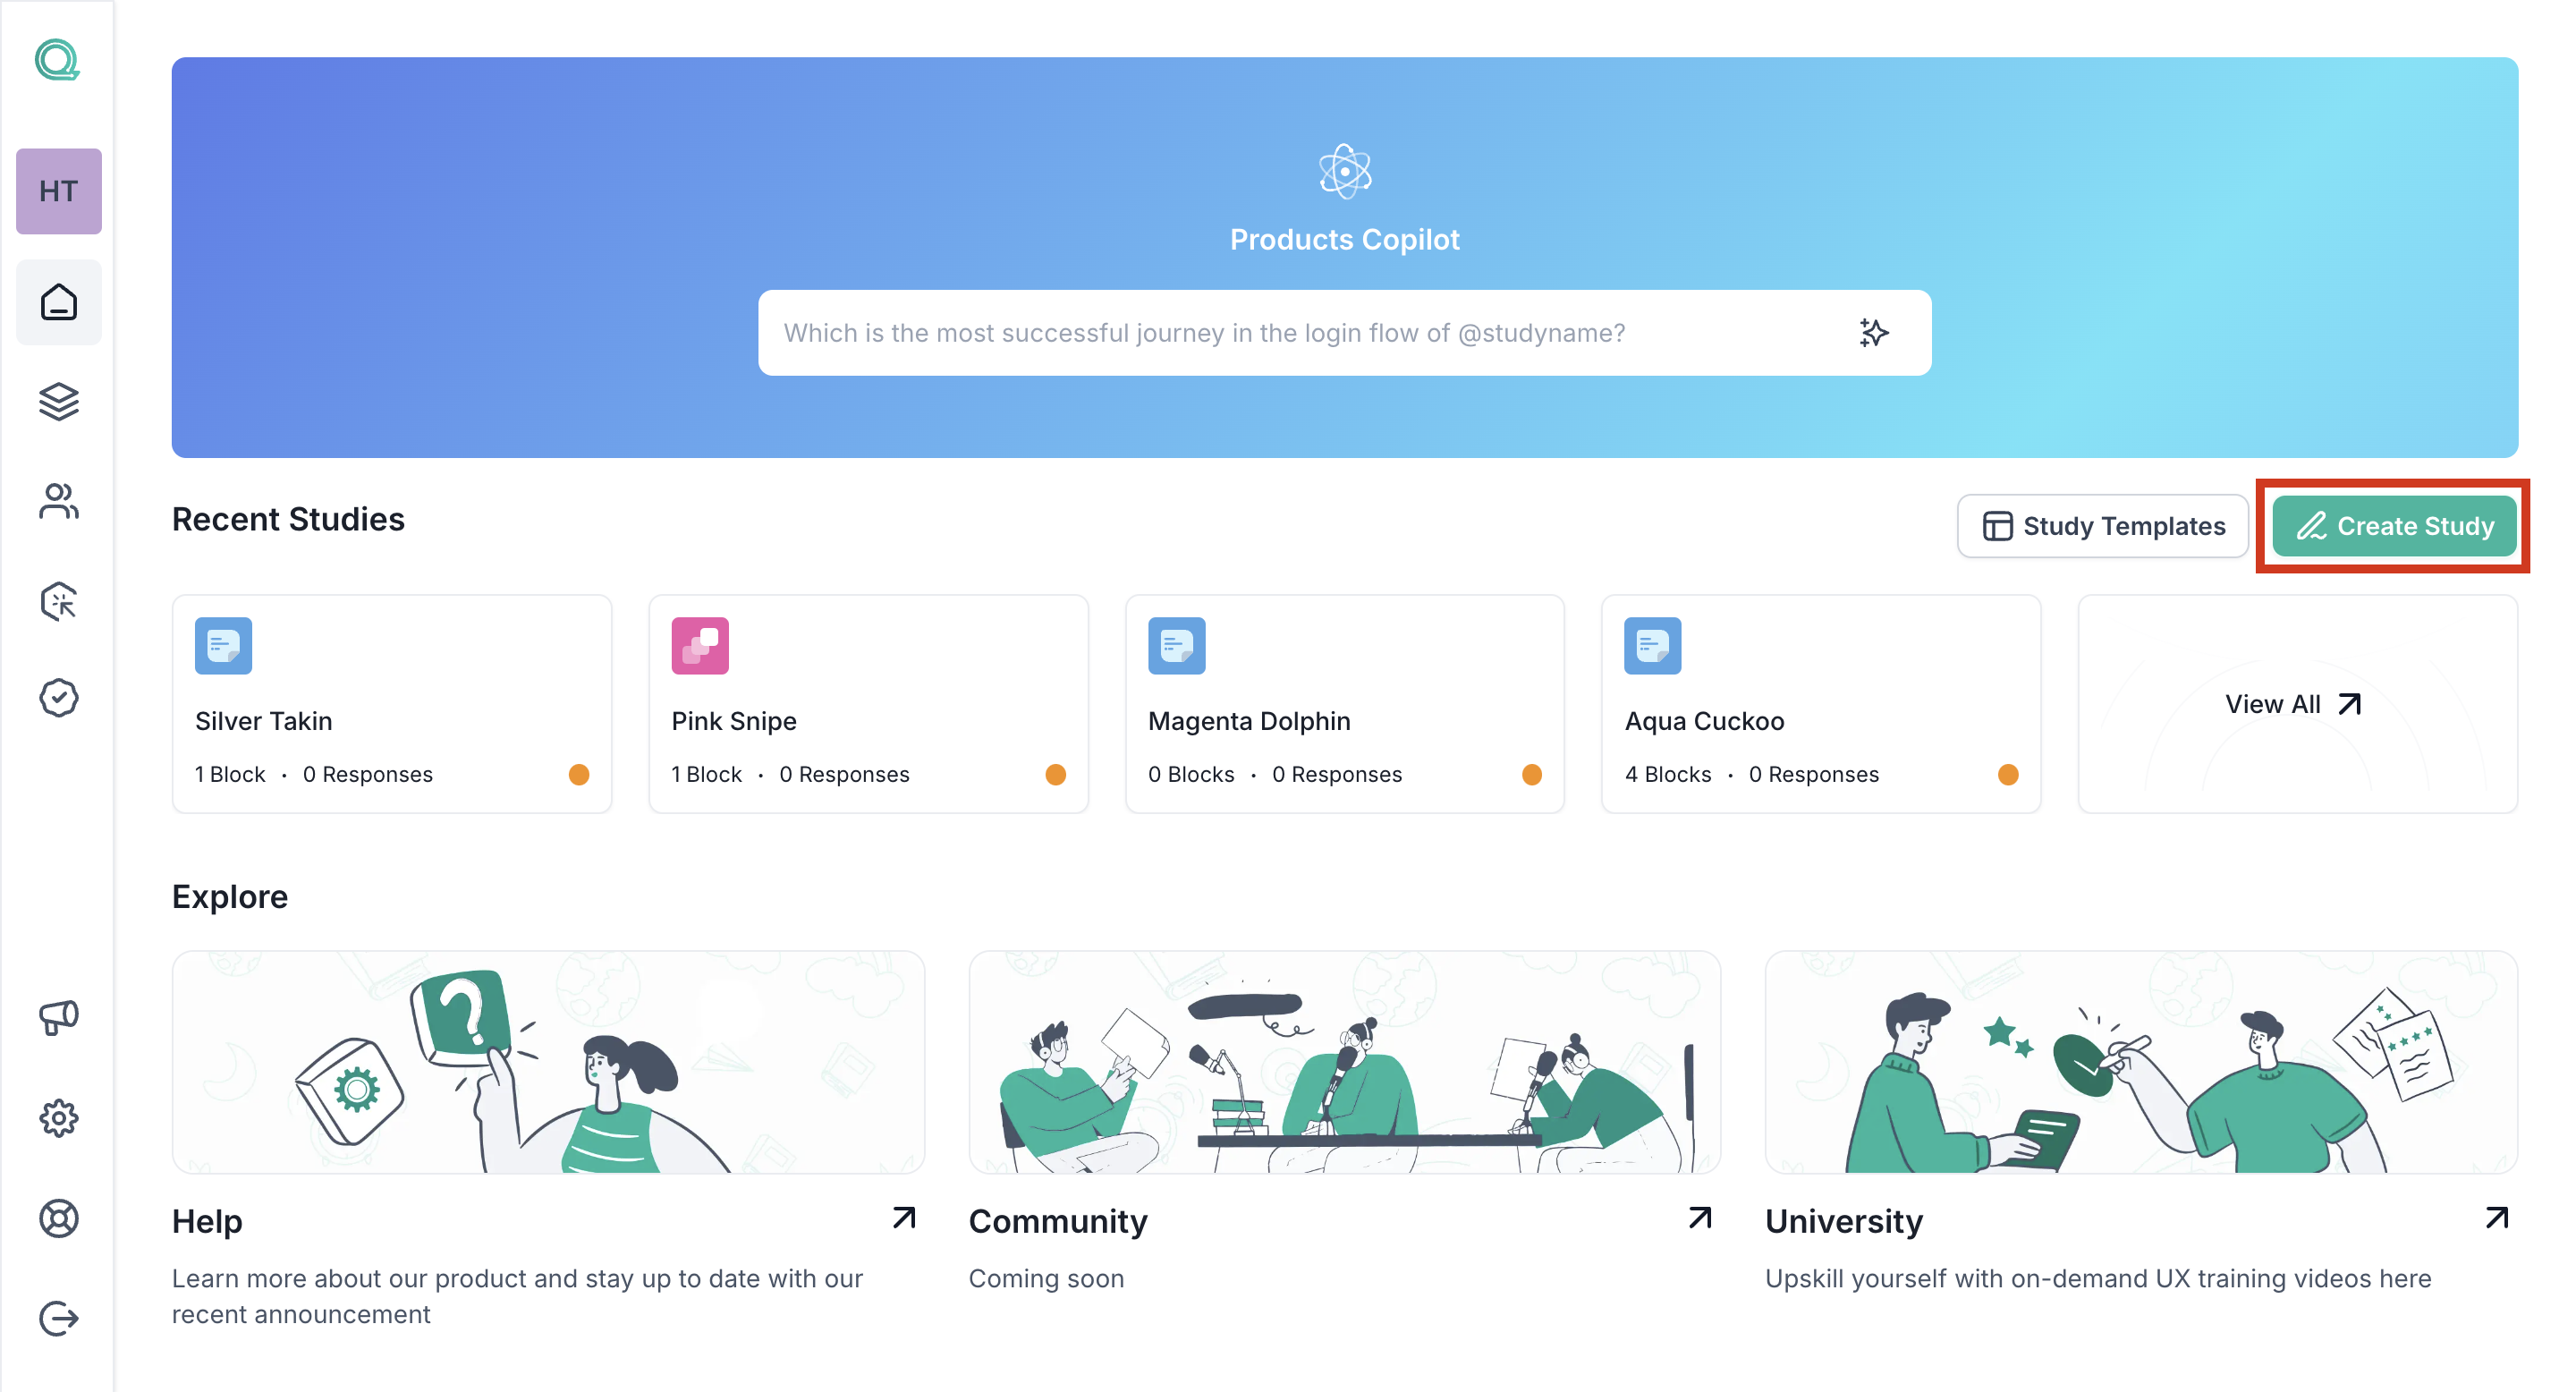
Step 1: Log in to your Qatalyst account, which will direct you to the dashboard. From the dashboard, click on the "Create Study" button to initiate the process of creating a new study.
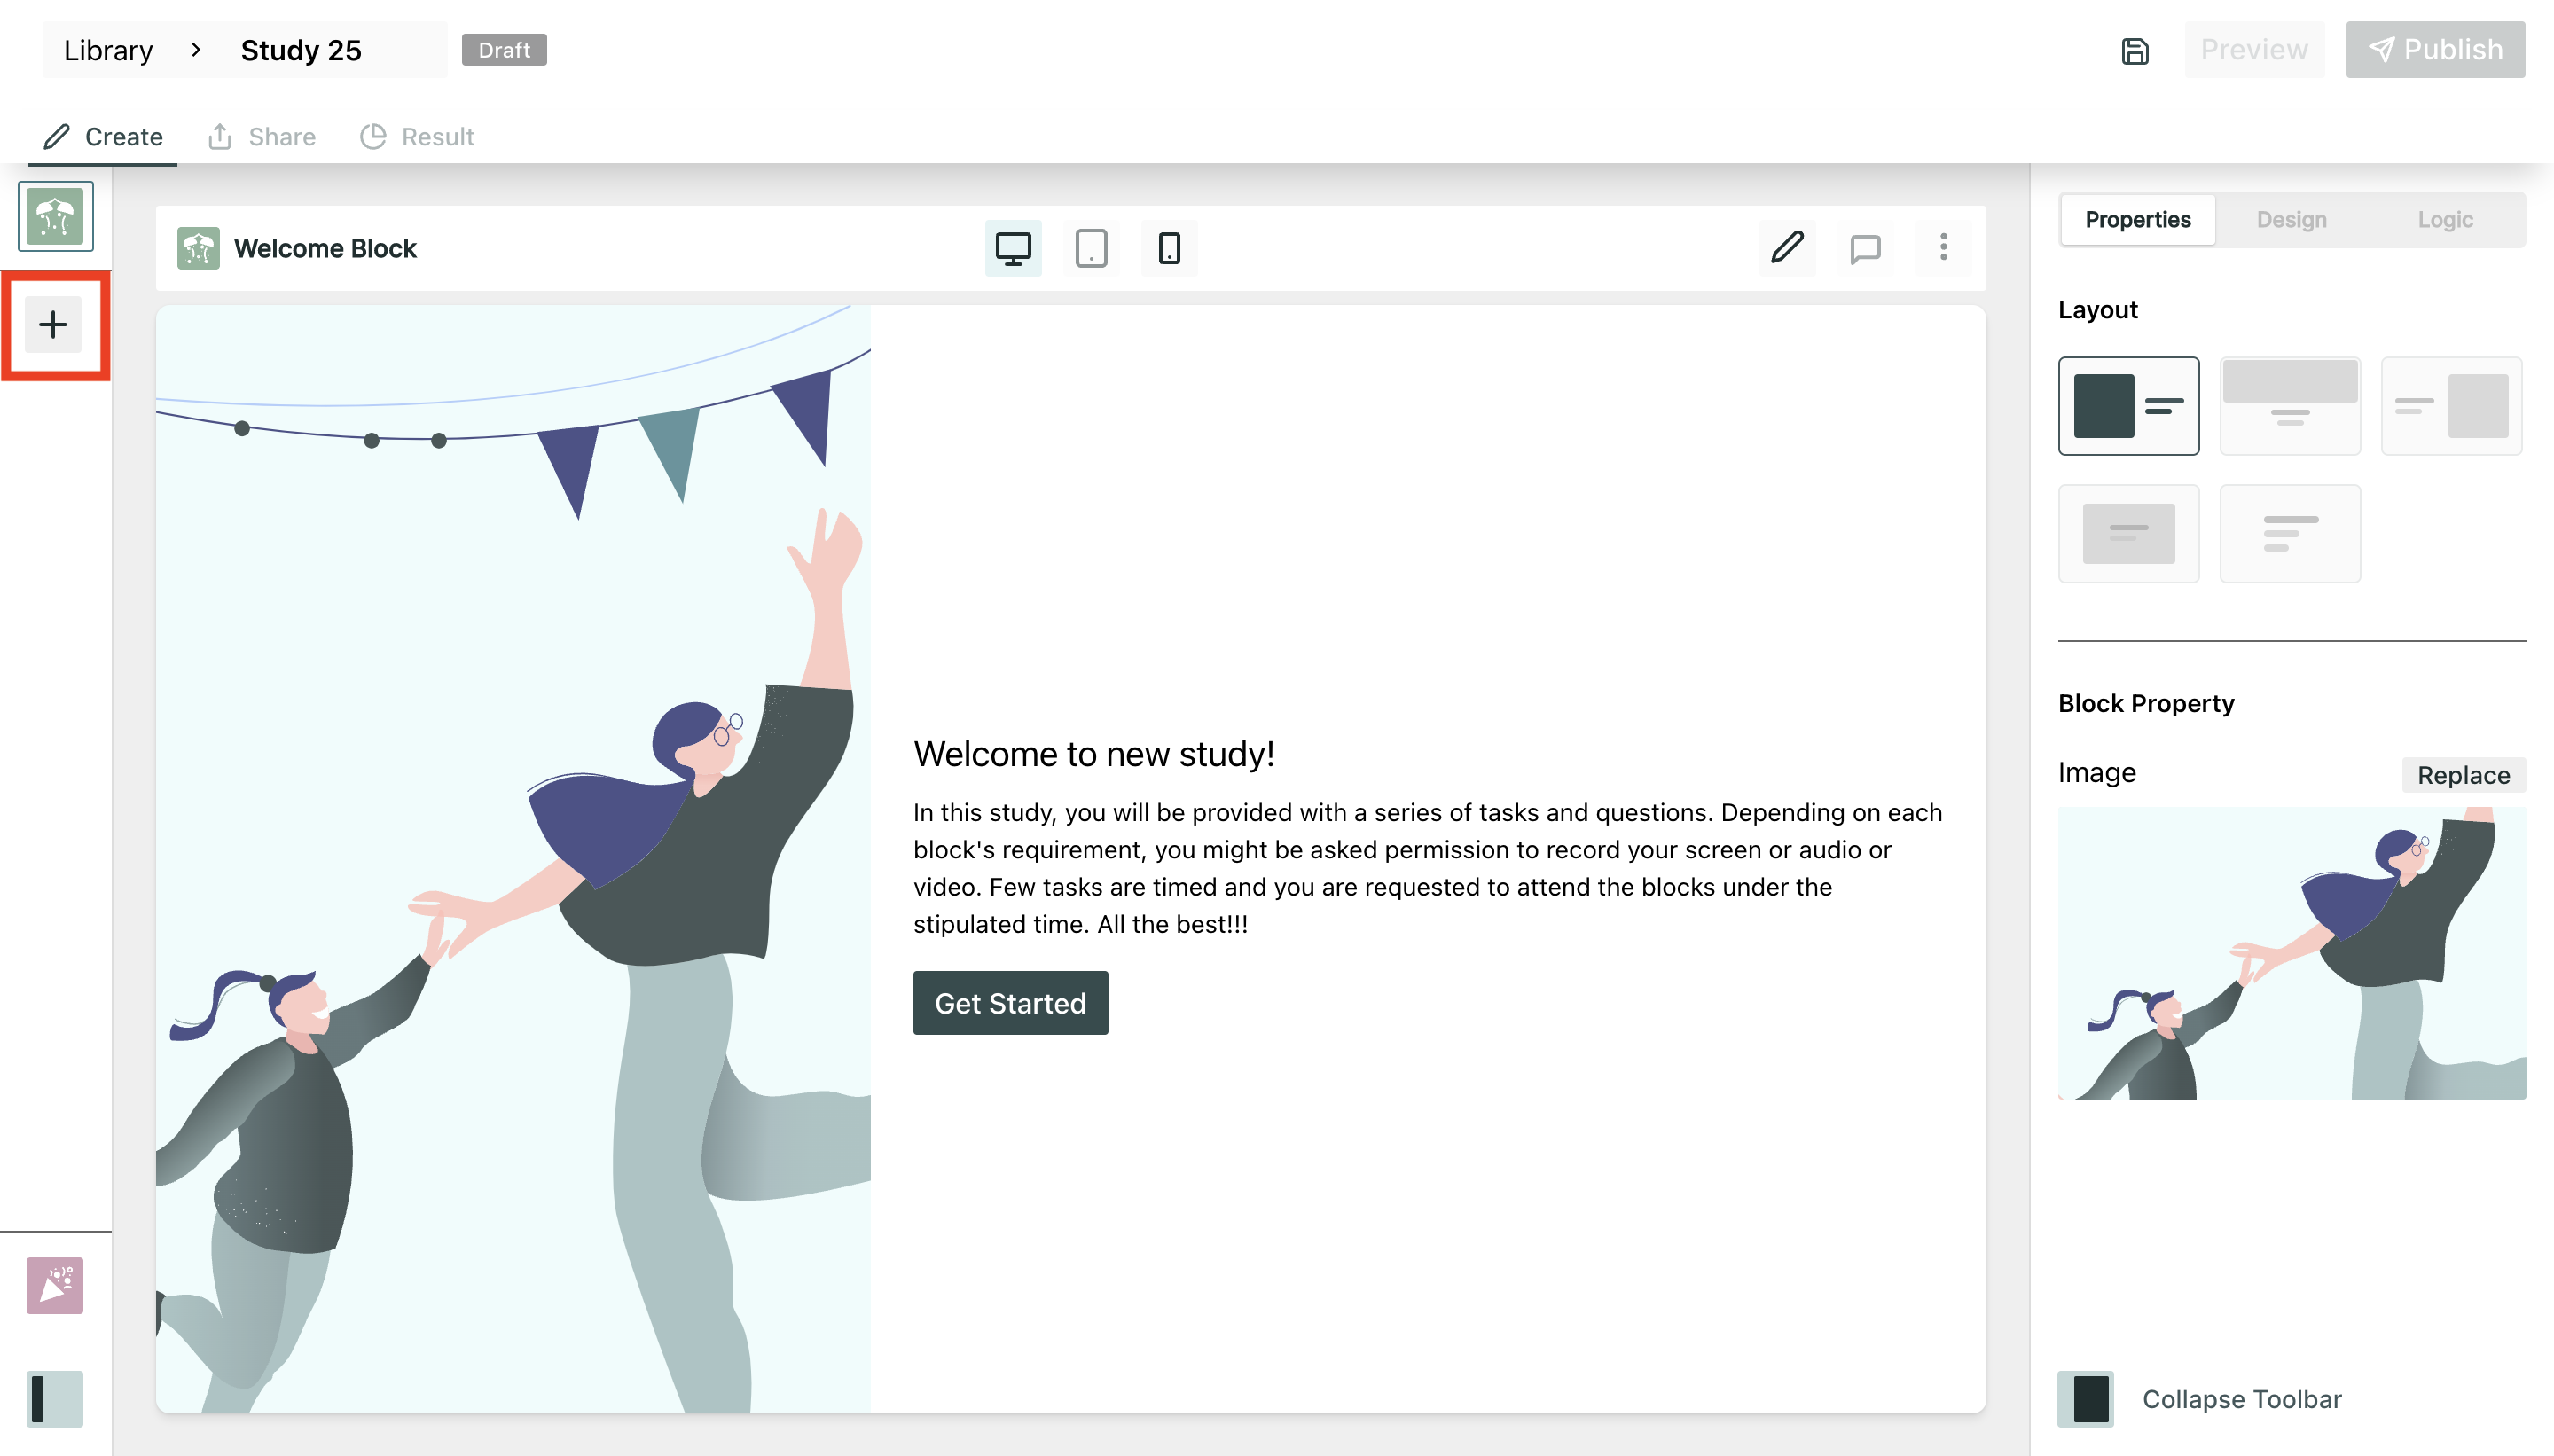
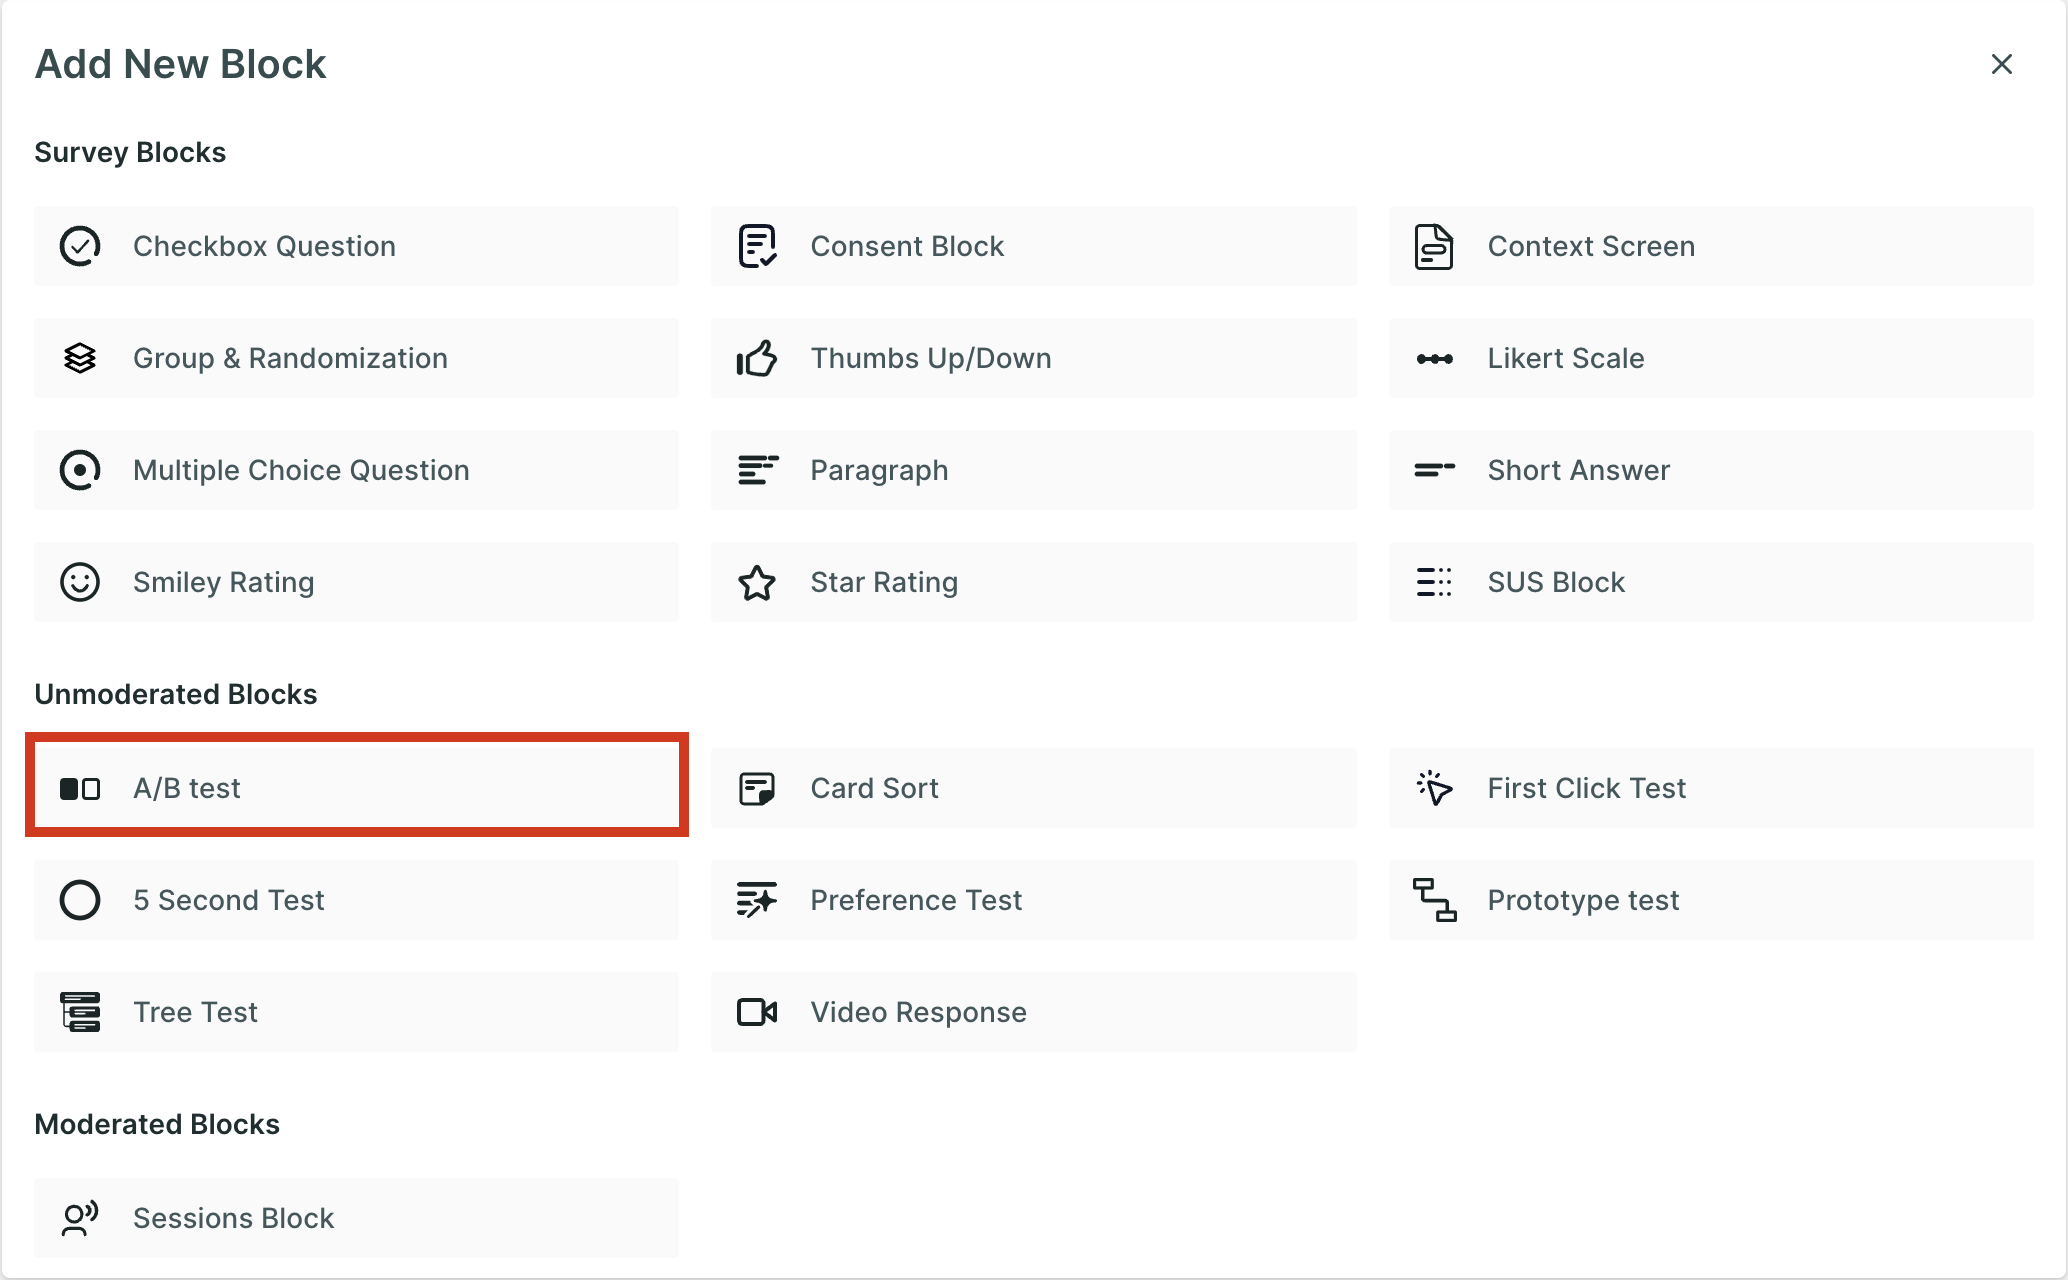
Step 2: Once you're in the study creation interface, locate the "+" button and click on it to add a new block. From the list of options that appear, select the "A/B test".
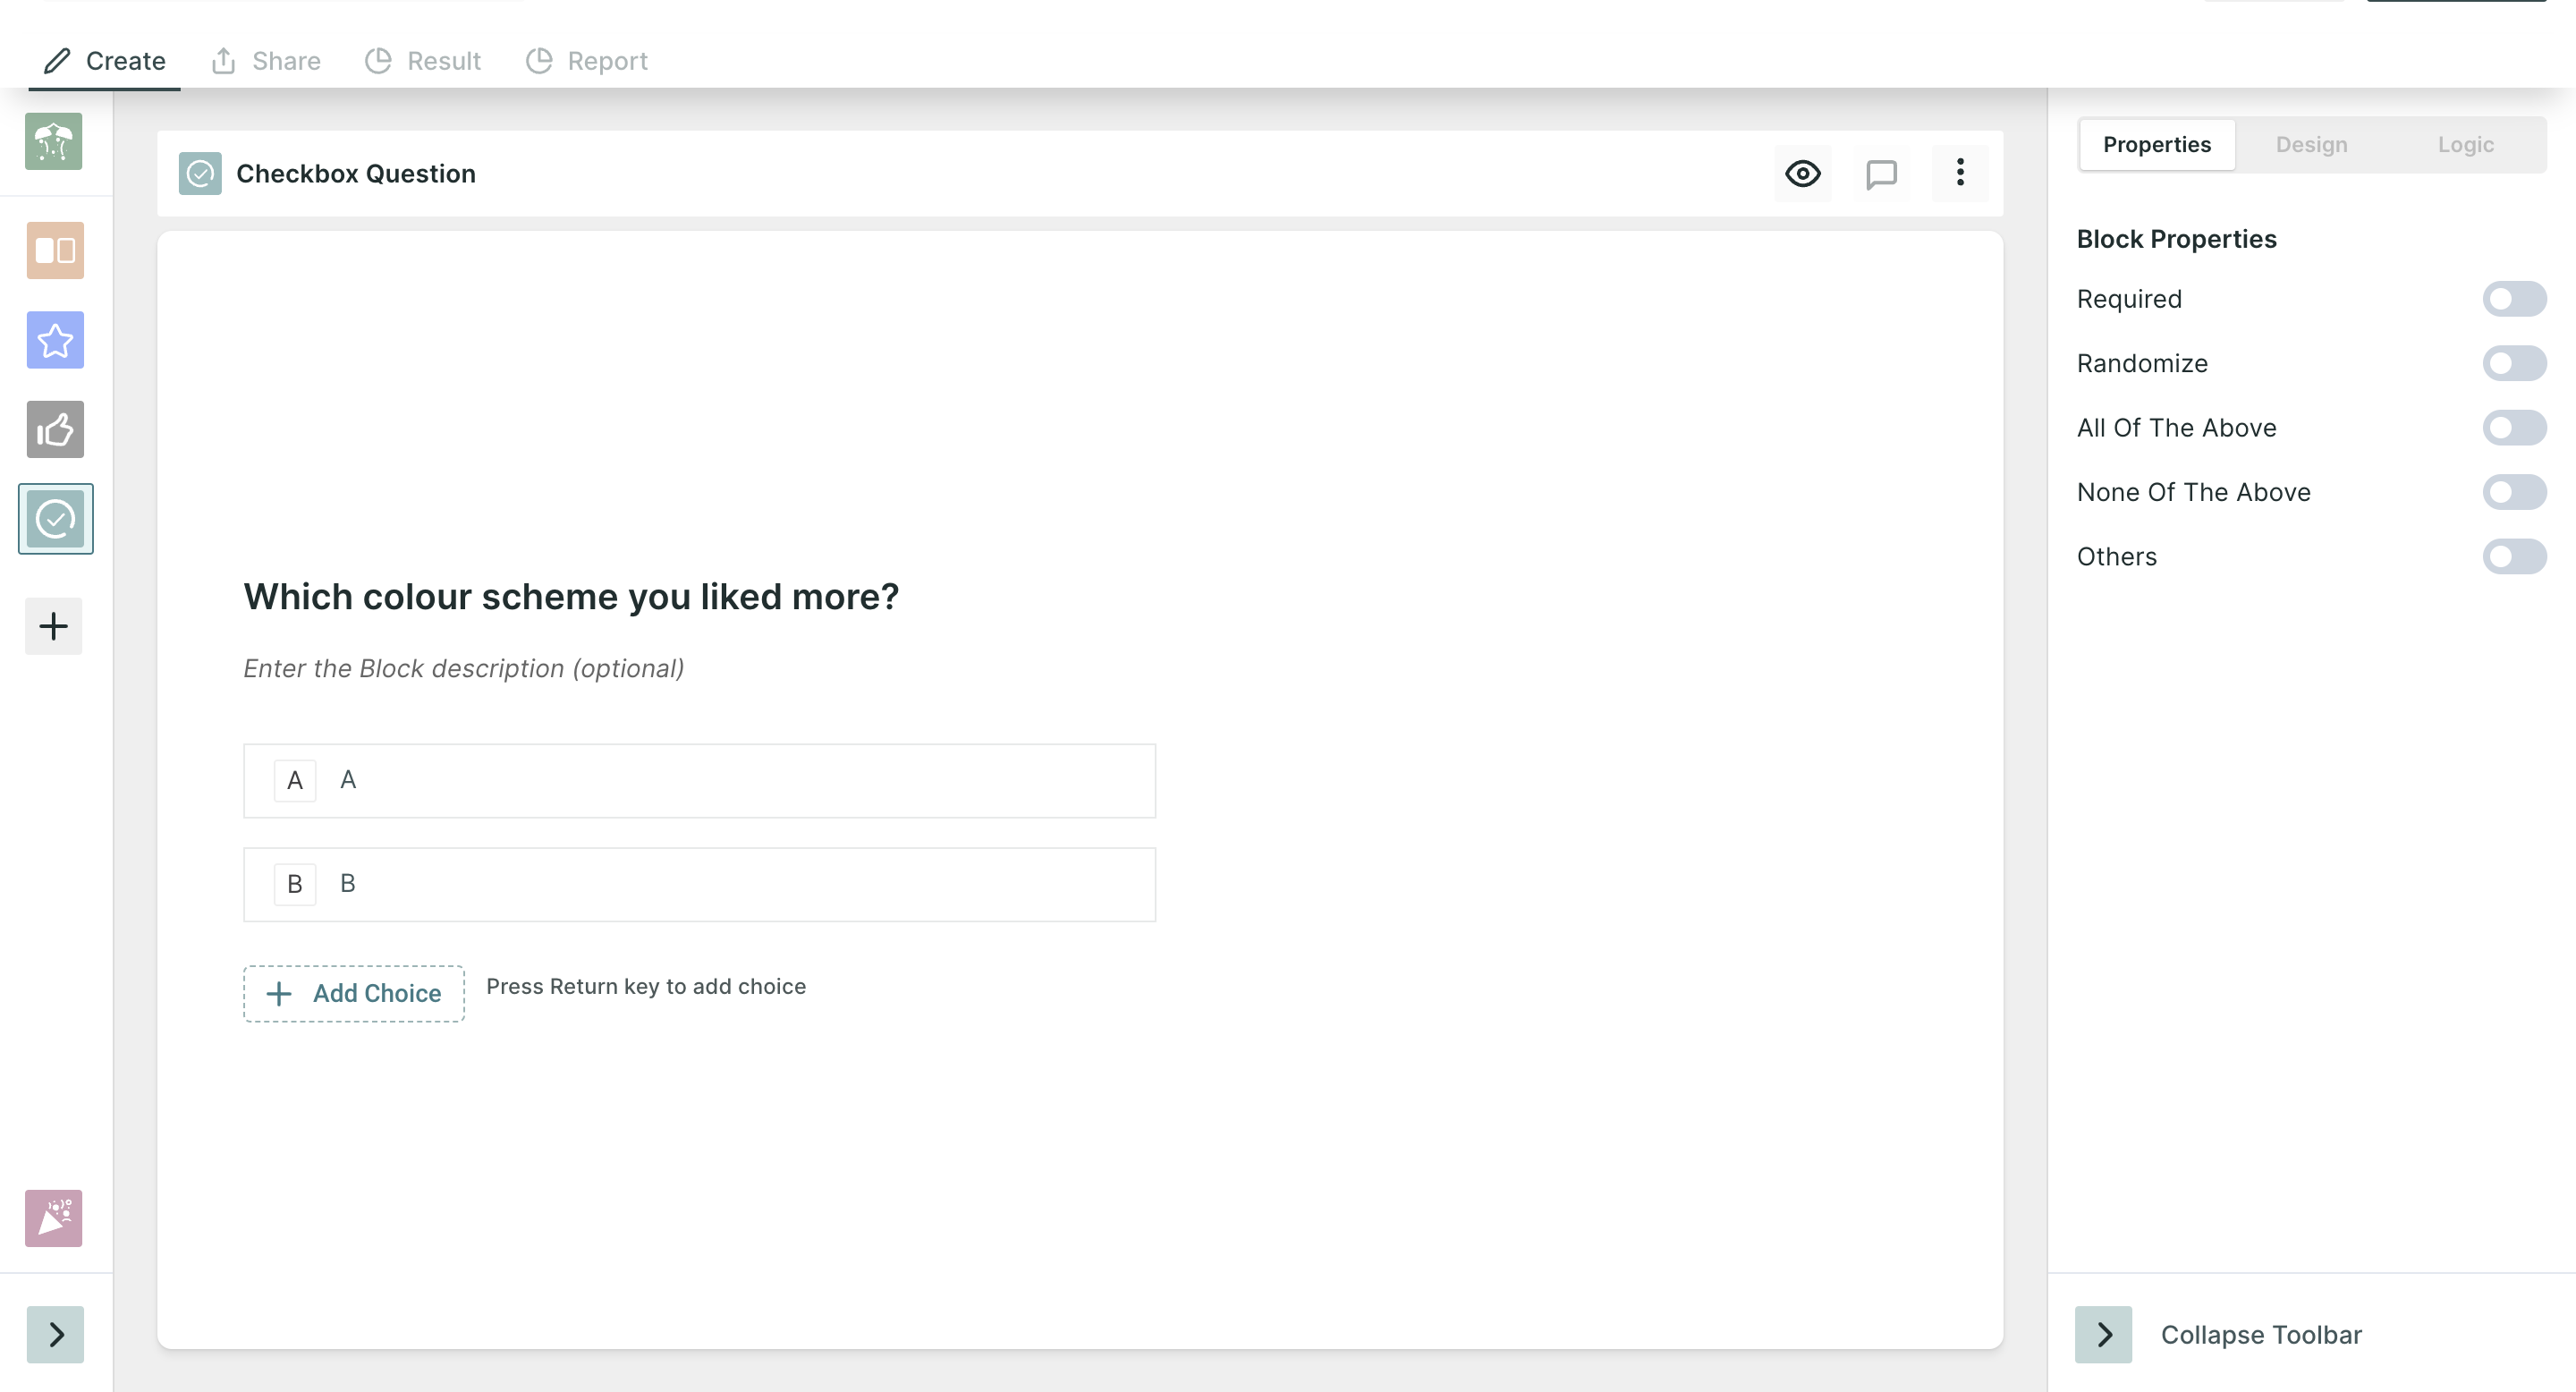
Step 3: To further enhance your study, continue adding additional survey blocks. Utilize the same process described in Step 2, clicking on the "+" button and selecting different block types to ask a variety of questions related to the test.
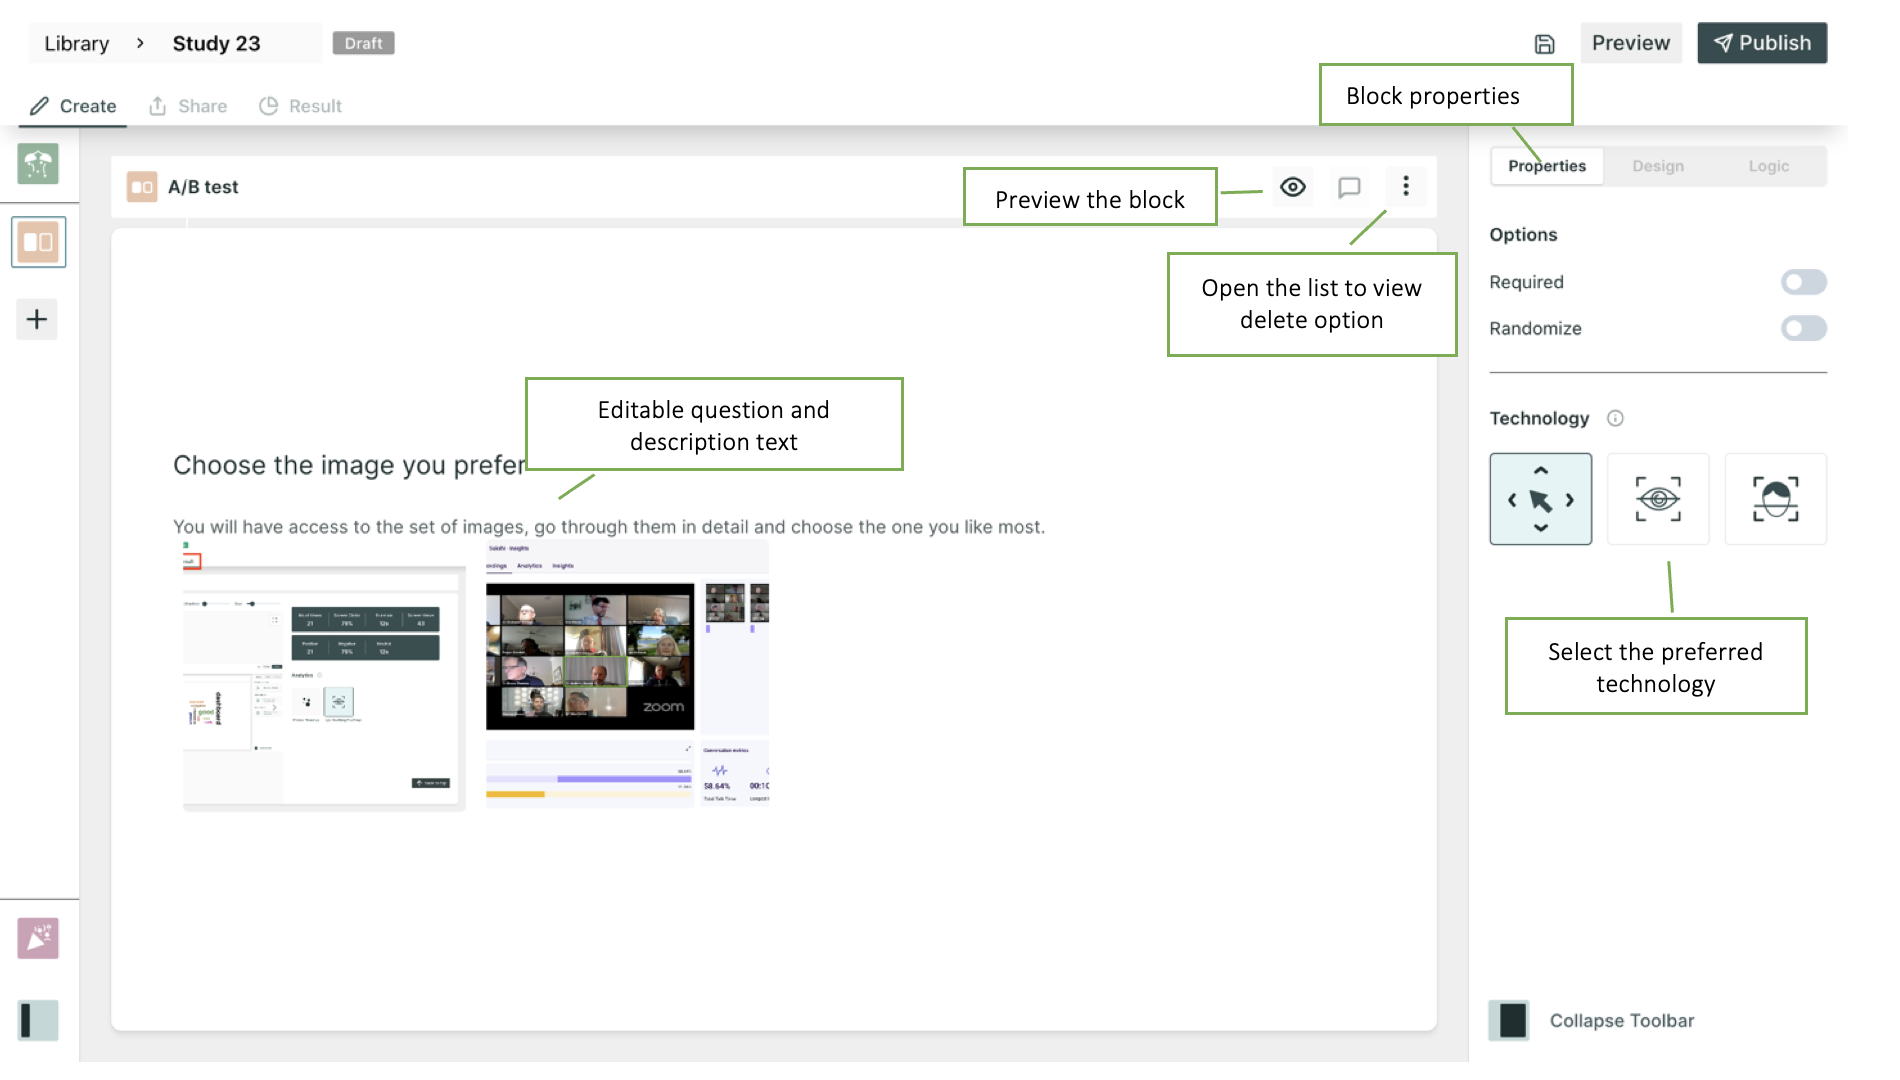
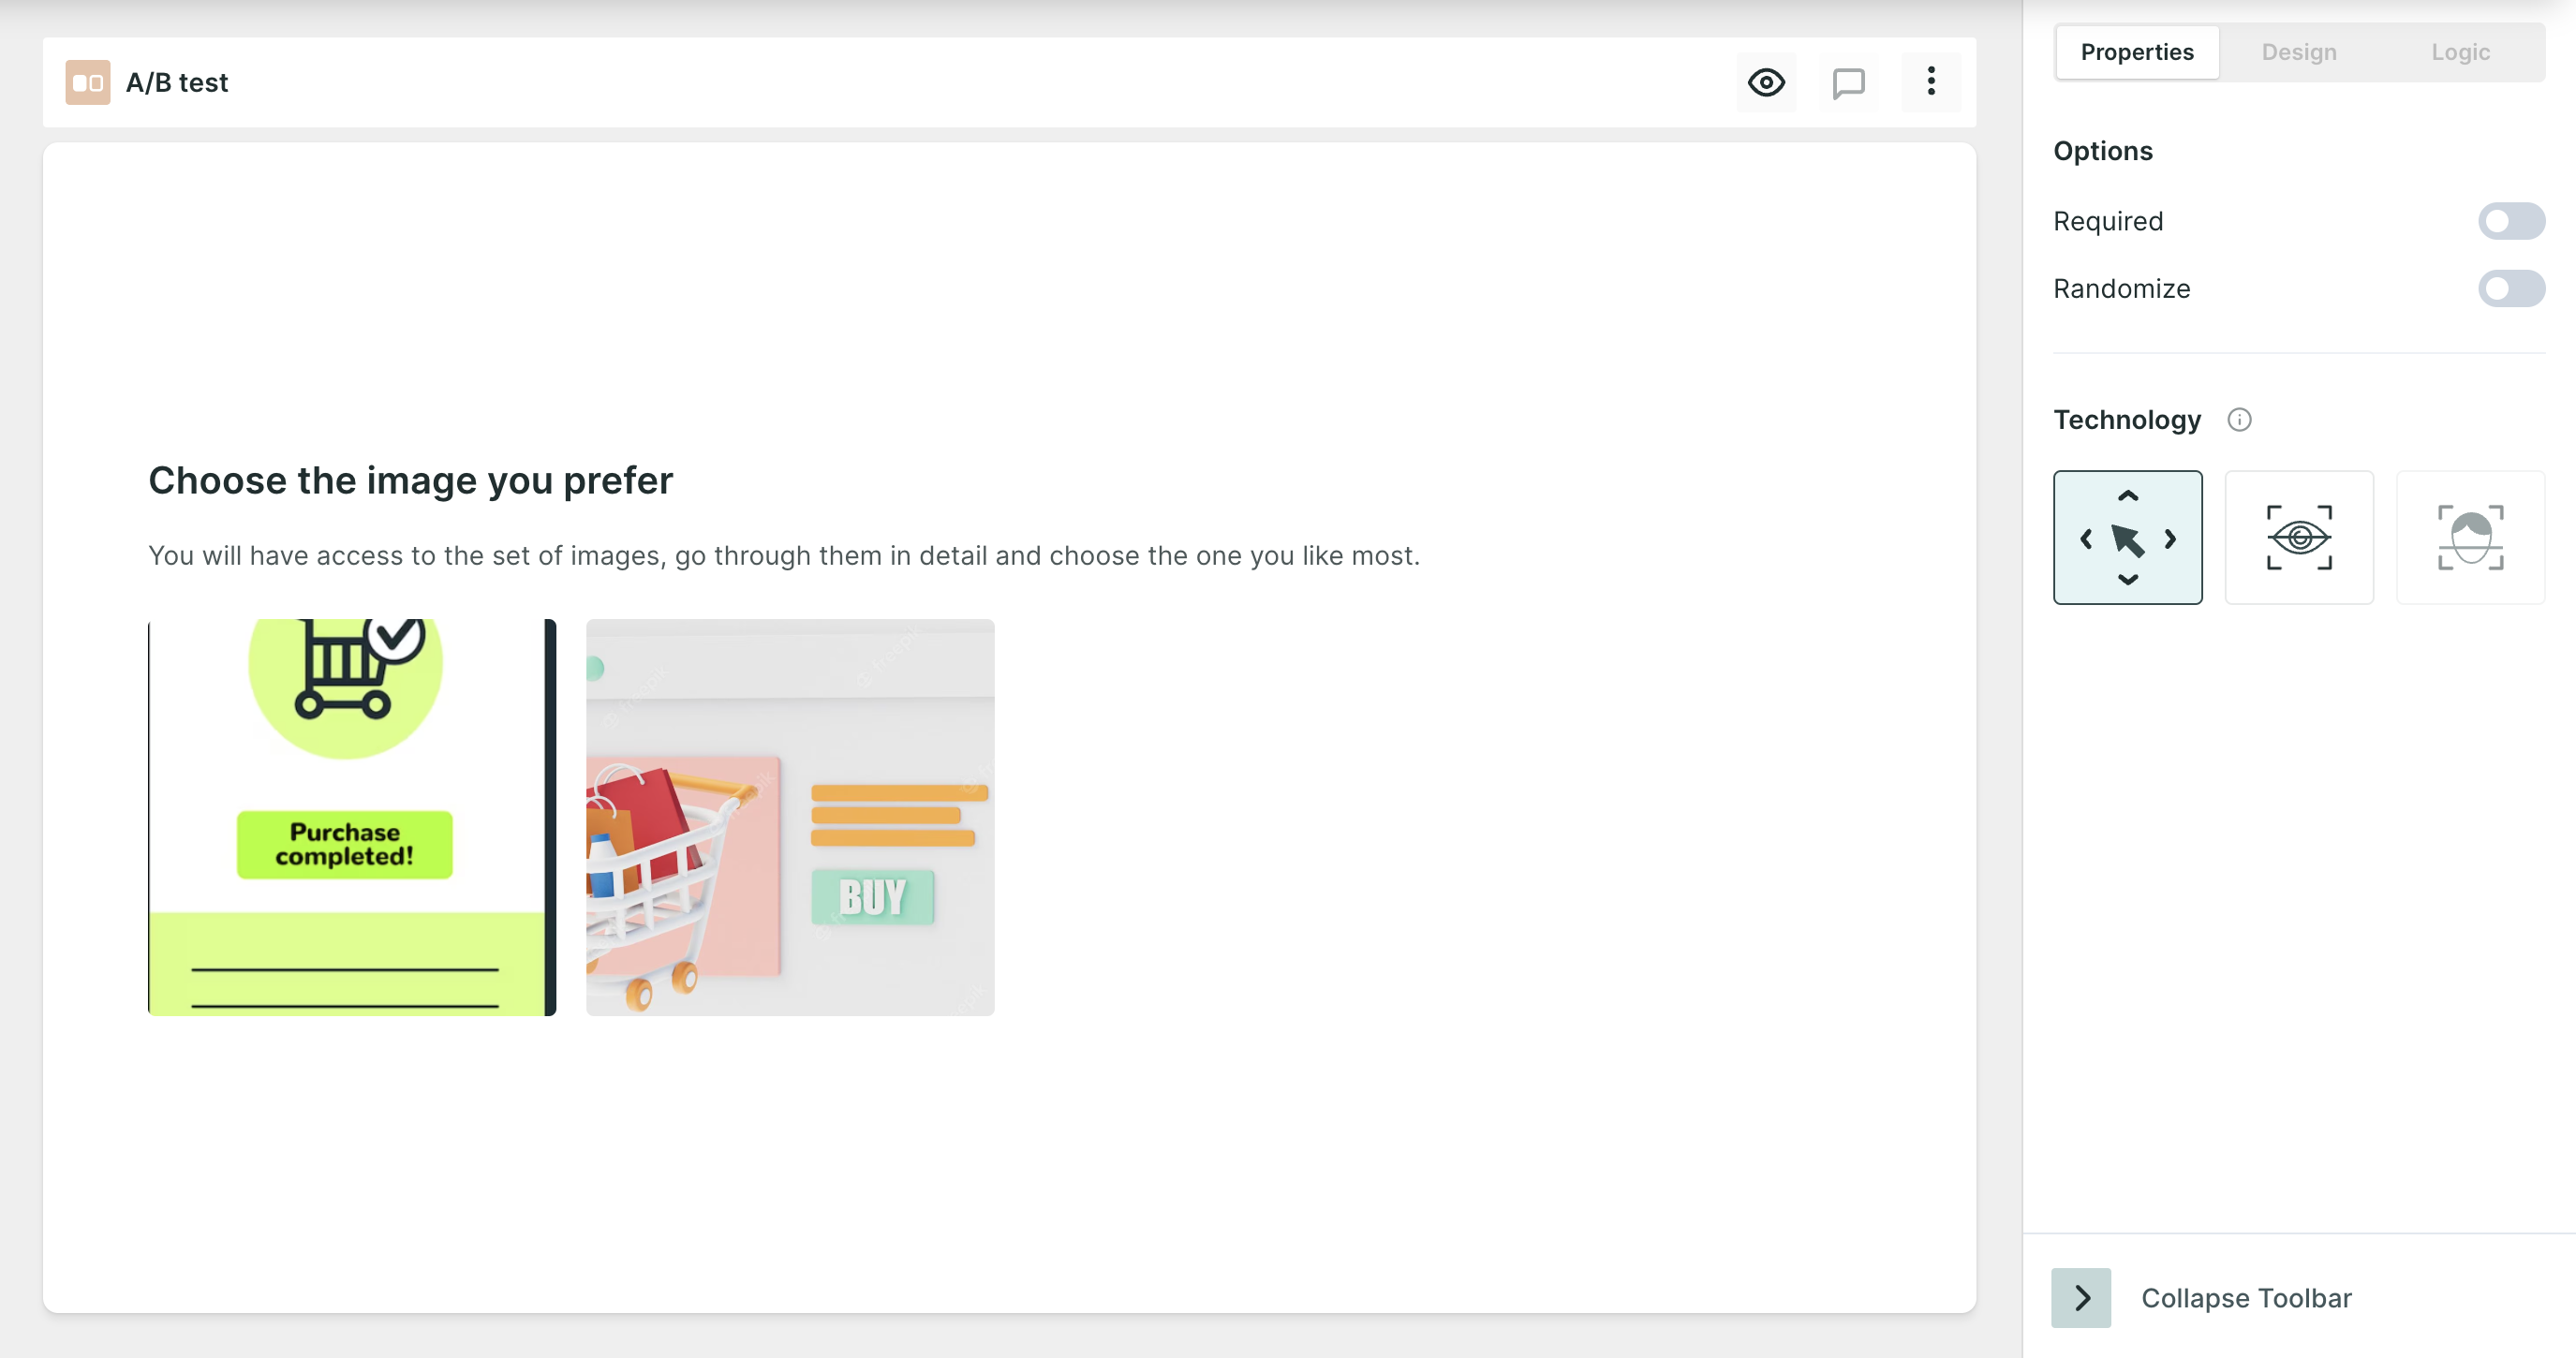
Properties
- Required: selecting one answer from the list is mandatory; the respondent will not be able to move to another question without answering the question.
- Randomize: The images will appear in random order.
Technology
- Mouse Tracking: Mouse tracking is a technology that records the movement of the user's cursor on the screen as they interact with the design. This technology can provide insights into how users navigate through the design.
- Eye tracking: Eye tracking is a technology that records the movement of the user's eyes as they interact with the design. This technology can provide insights into which elements of the design users are looking for, which areas are most engaging, and which areas may need improvement.
- Facial Coding: Facial coding is a technology that is used to analyze users' facial expressions as they interact with the design. This technology can provide insights into users' emotional responses to the product. It can be used to optimize the product's design and messaging to elicit more positive emotional responses from users.
To select the technologies, click on the boxes.
You can select more than one tracking technology at once too.
Result View 📊
Once the respondents have taken the test, you will be able to see the analytics in the result section.
On the first dashboard of the result, you will be presented with valuable quantitative data showcasing the percentage of respondents who have chosen each respective image.
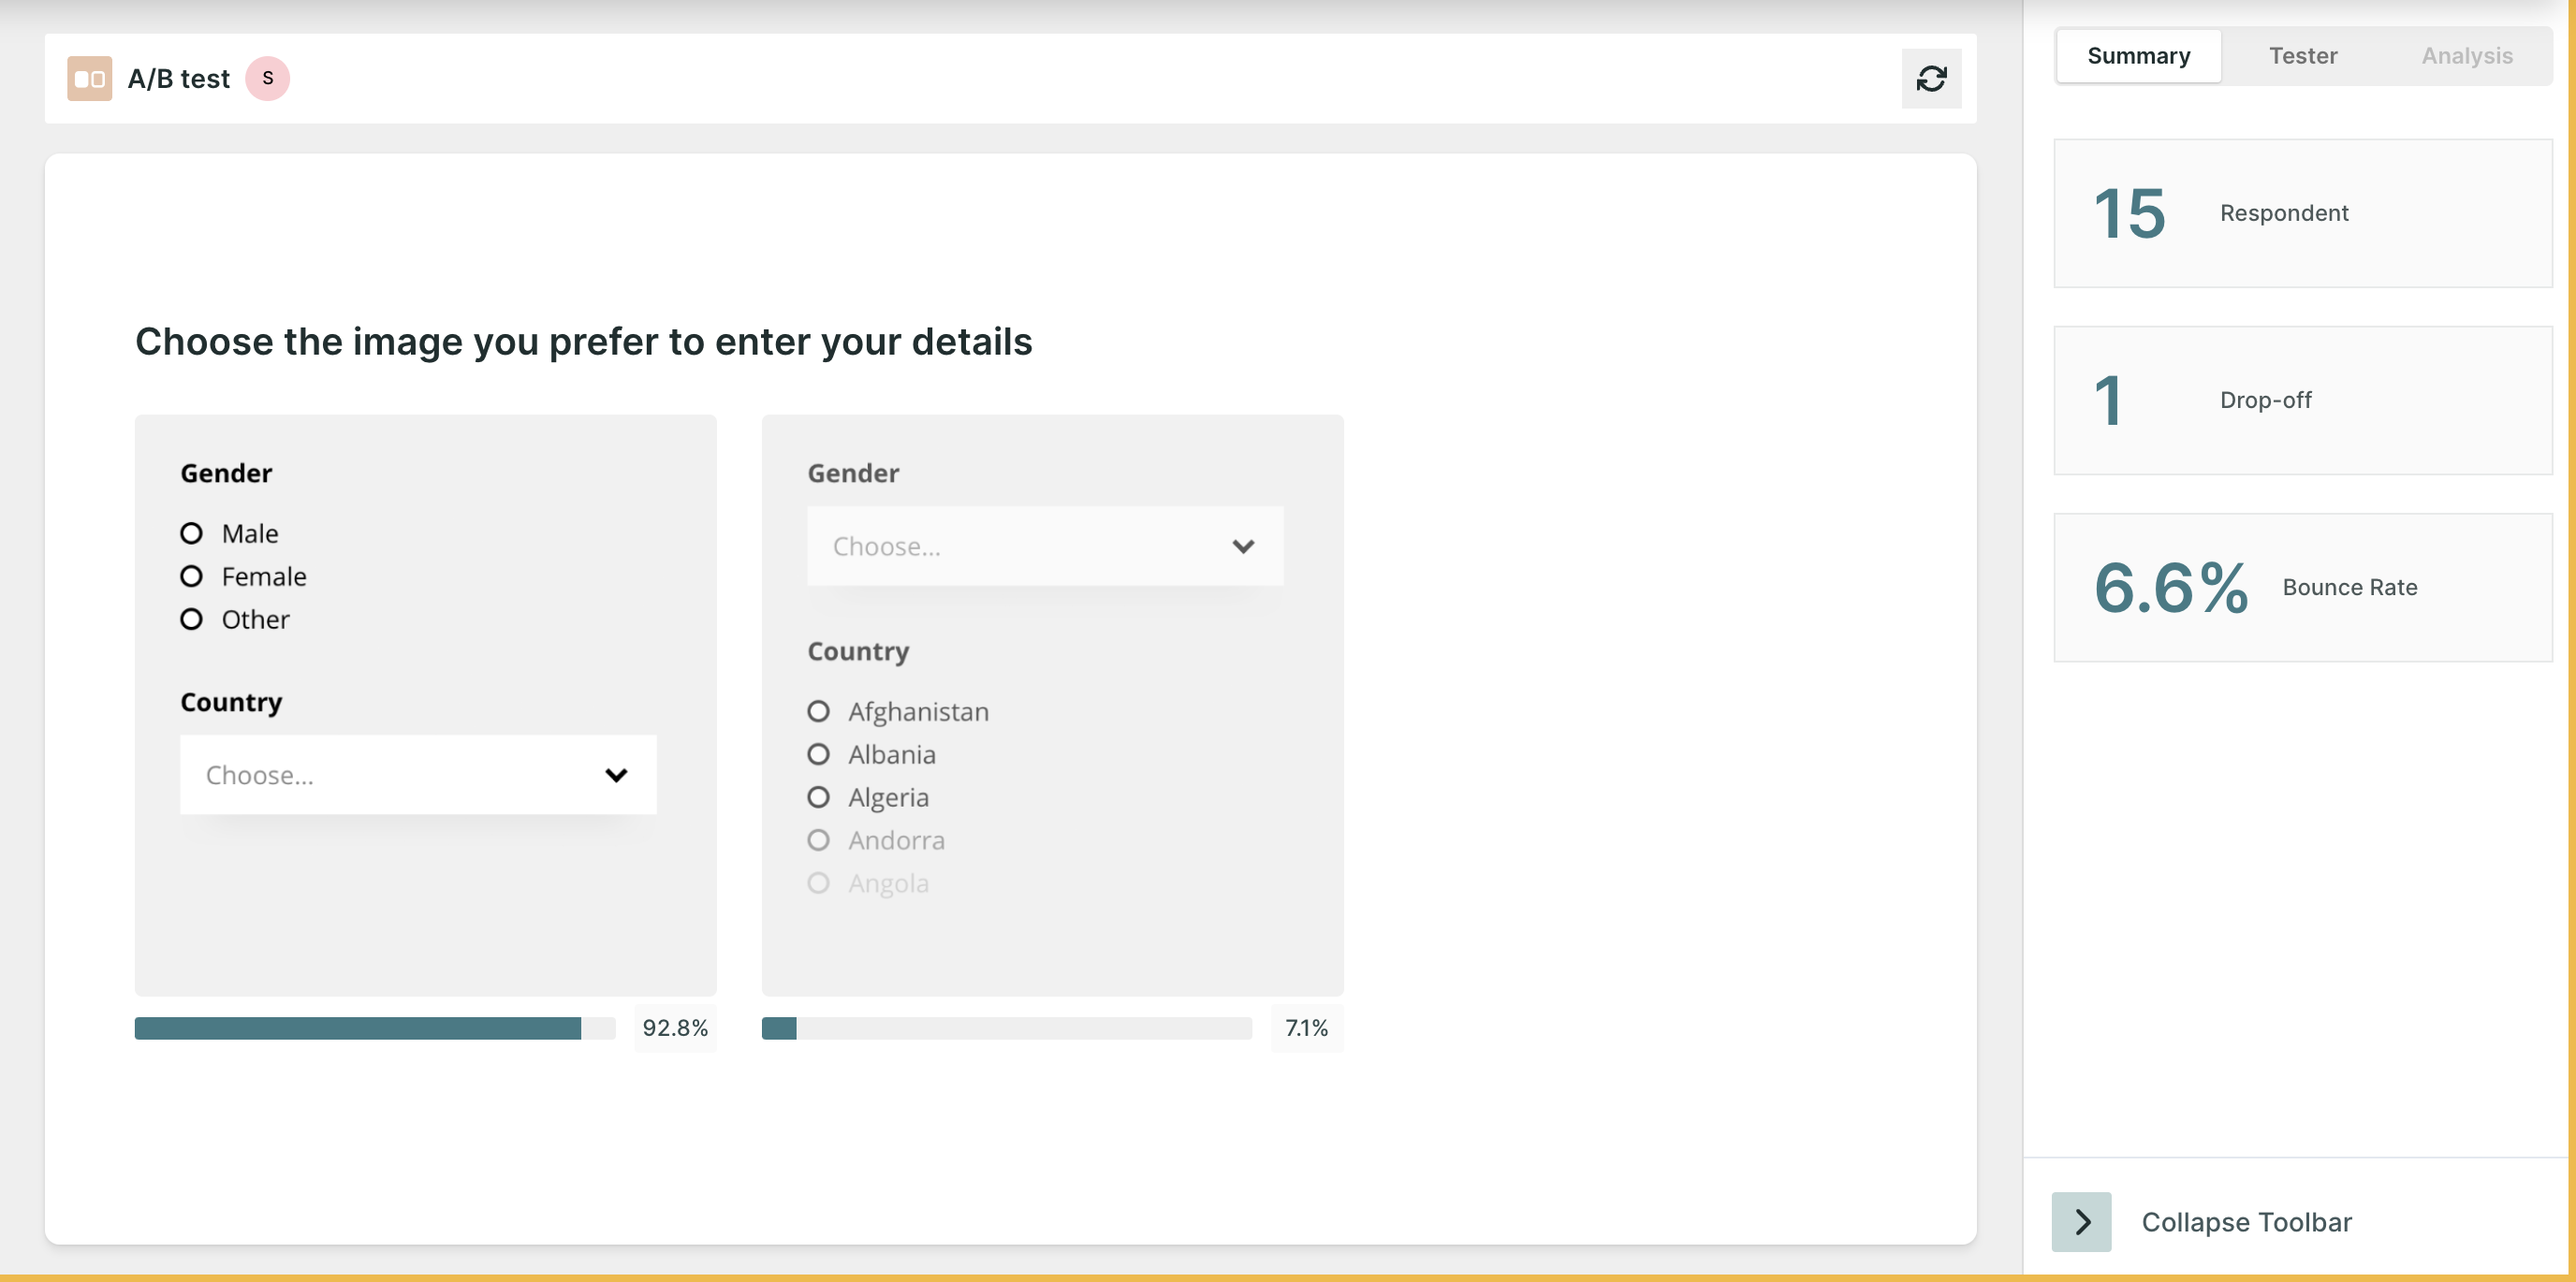
- Respondents: Number of people who initiated the test block.
- Skip: The Number of people who choose to skip the block.
- Drop-off: Number of people who have not moved on to the next block.
- Bounce Rate: ((Dropoff + Skip)/ Number of Responses)*100 . (In Percentage)
On the next screen, based on the technology selected, you will find the following metrics:
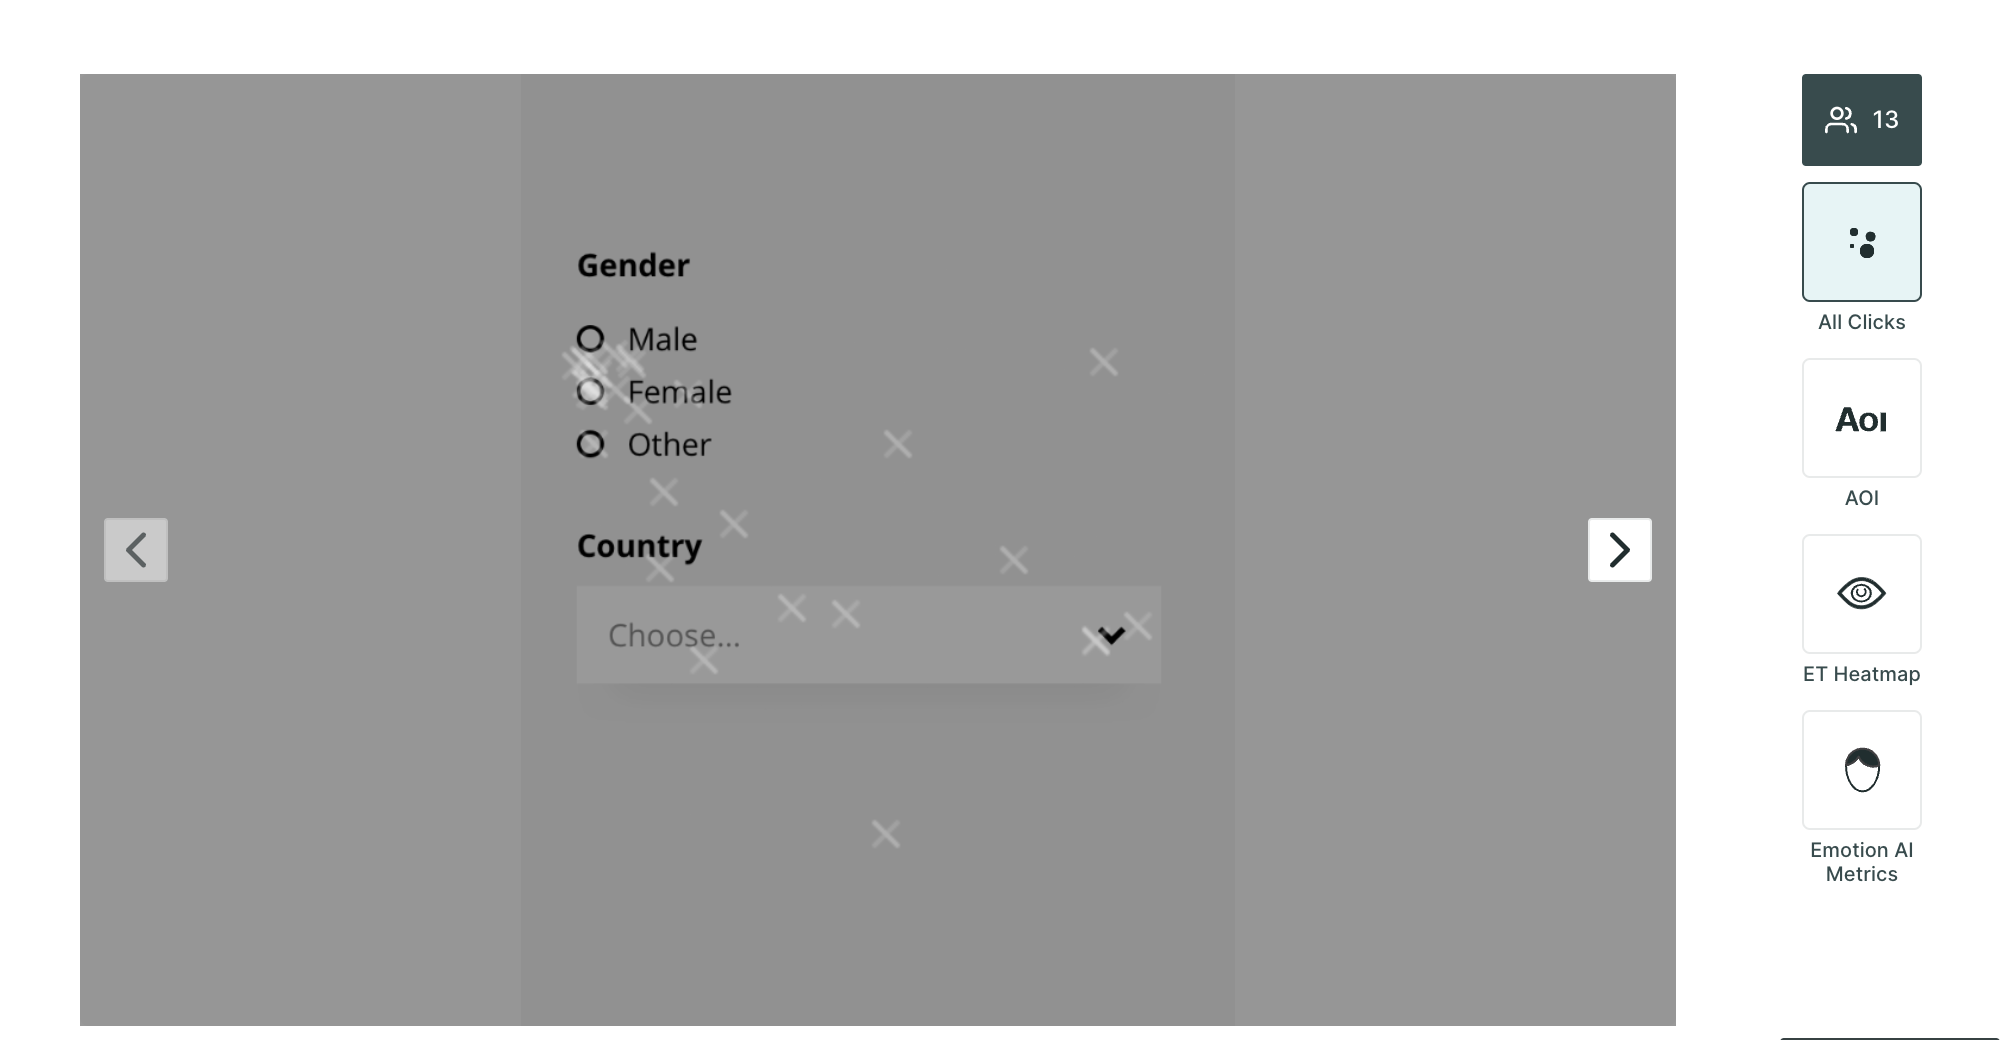
- All clicks: All Clicks metrics provide insights on the clicks made by the respondents on the image. It gives a complete view of how users interact with the image. The size of a click depends on how many times respondents have clicked in that area. This helps us understand which parts of the picture are getting more attention from users.
- AOI (Area of Interest): On the image, you can create AOIs. Within AOIs, you can glean insights into metrics such as time spent, average time to first fixation, and average fixation duration providing a deeper understanding of user engagement.

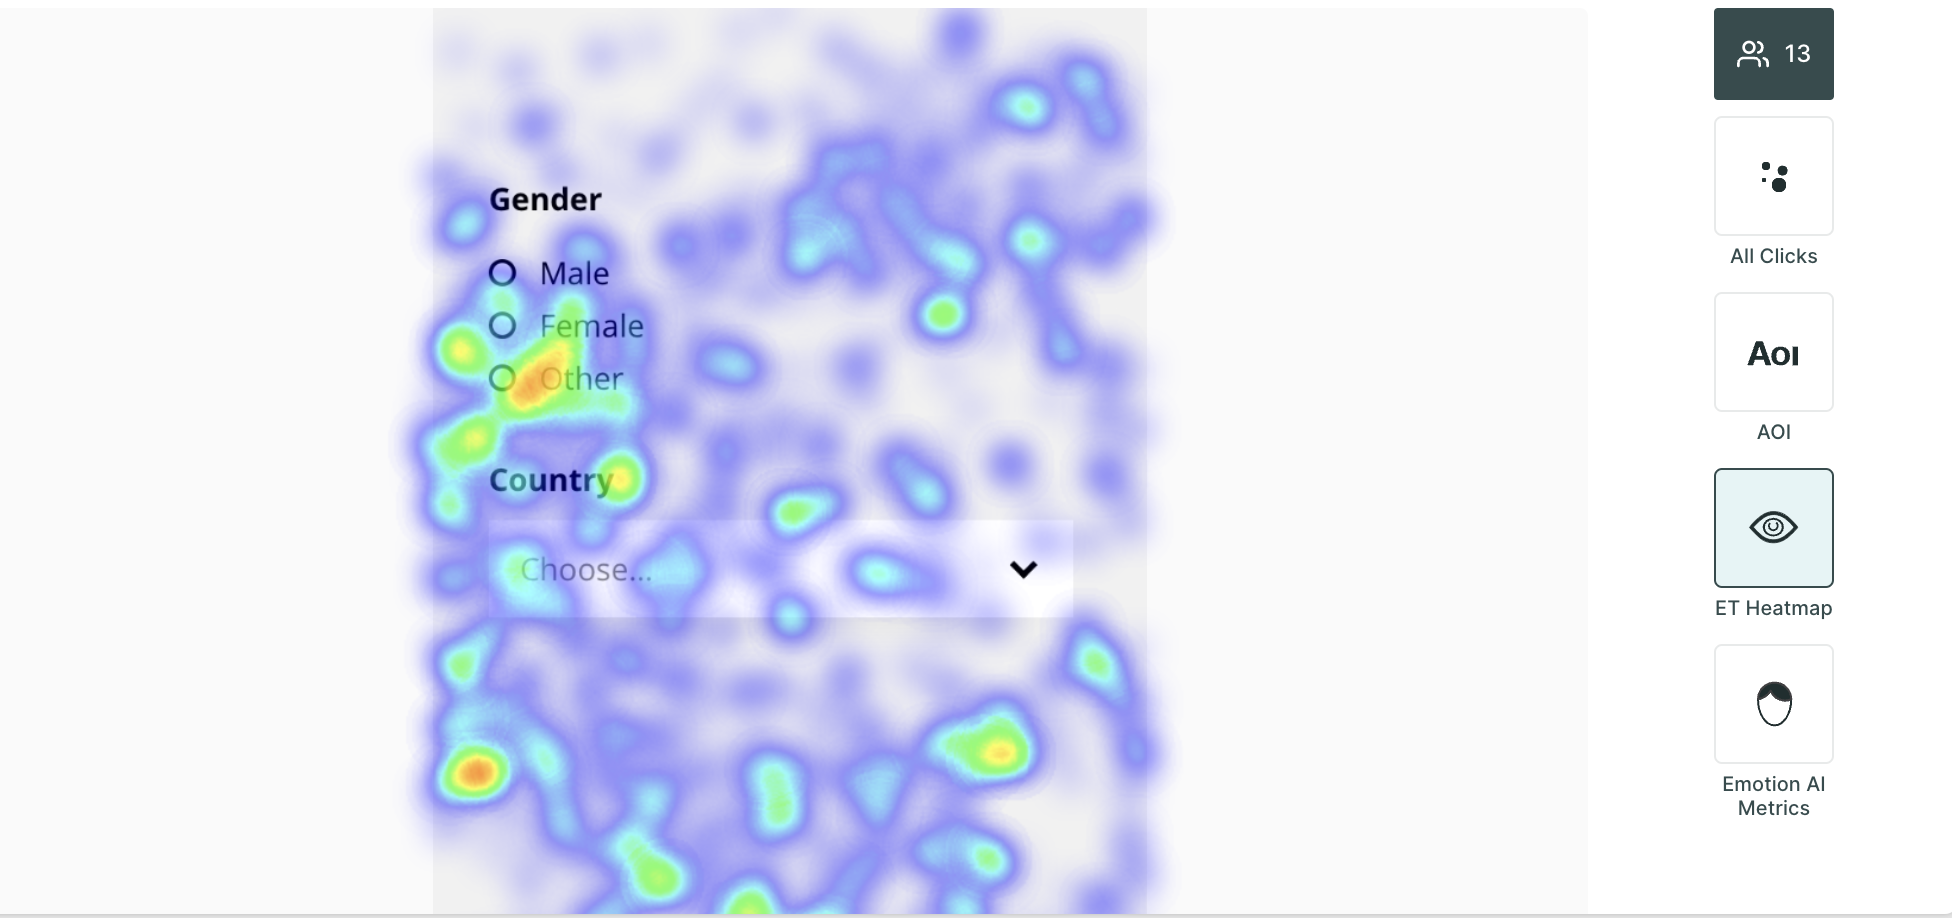
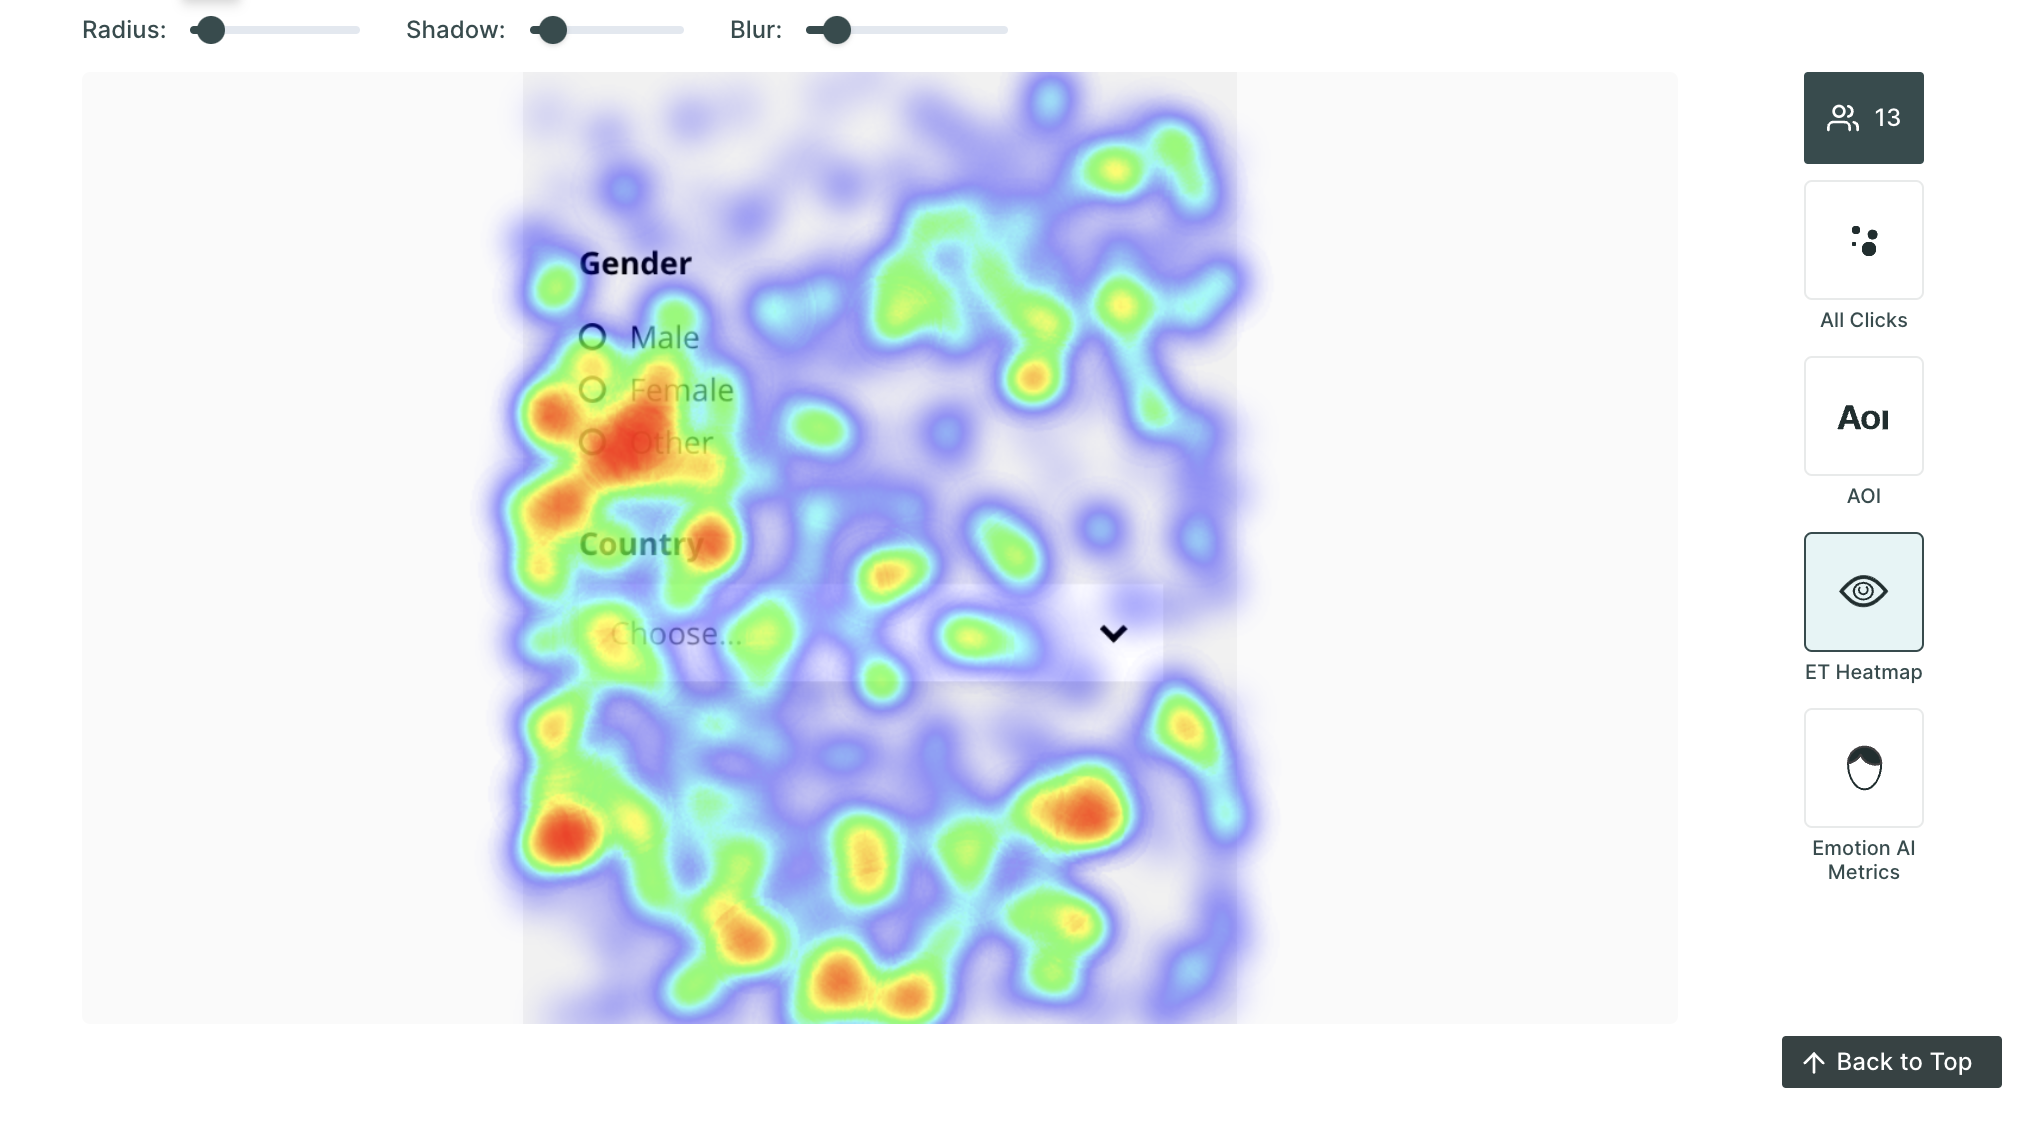
- ET Heatmap: An eye-tracking heatmap is a visual representation of where people look on a page. It is created by tracking the eye movements of users as they interact with the image. The heatmap then shows the areas of the screen that received the most attention, with the hottest areas being those that were looked at the most.
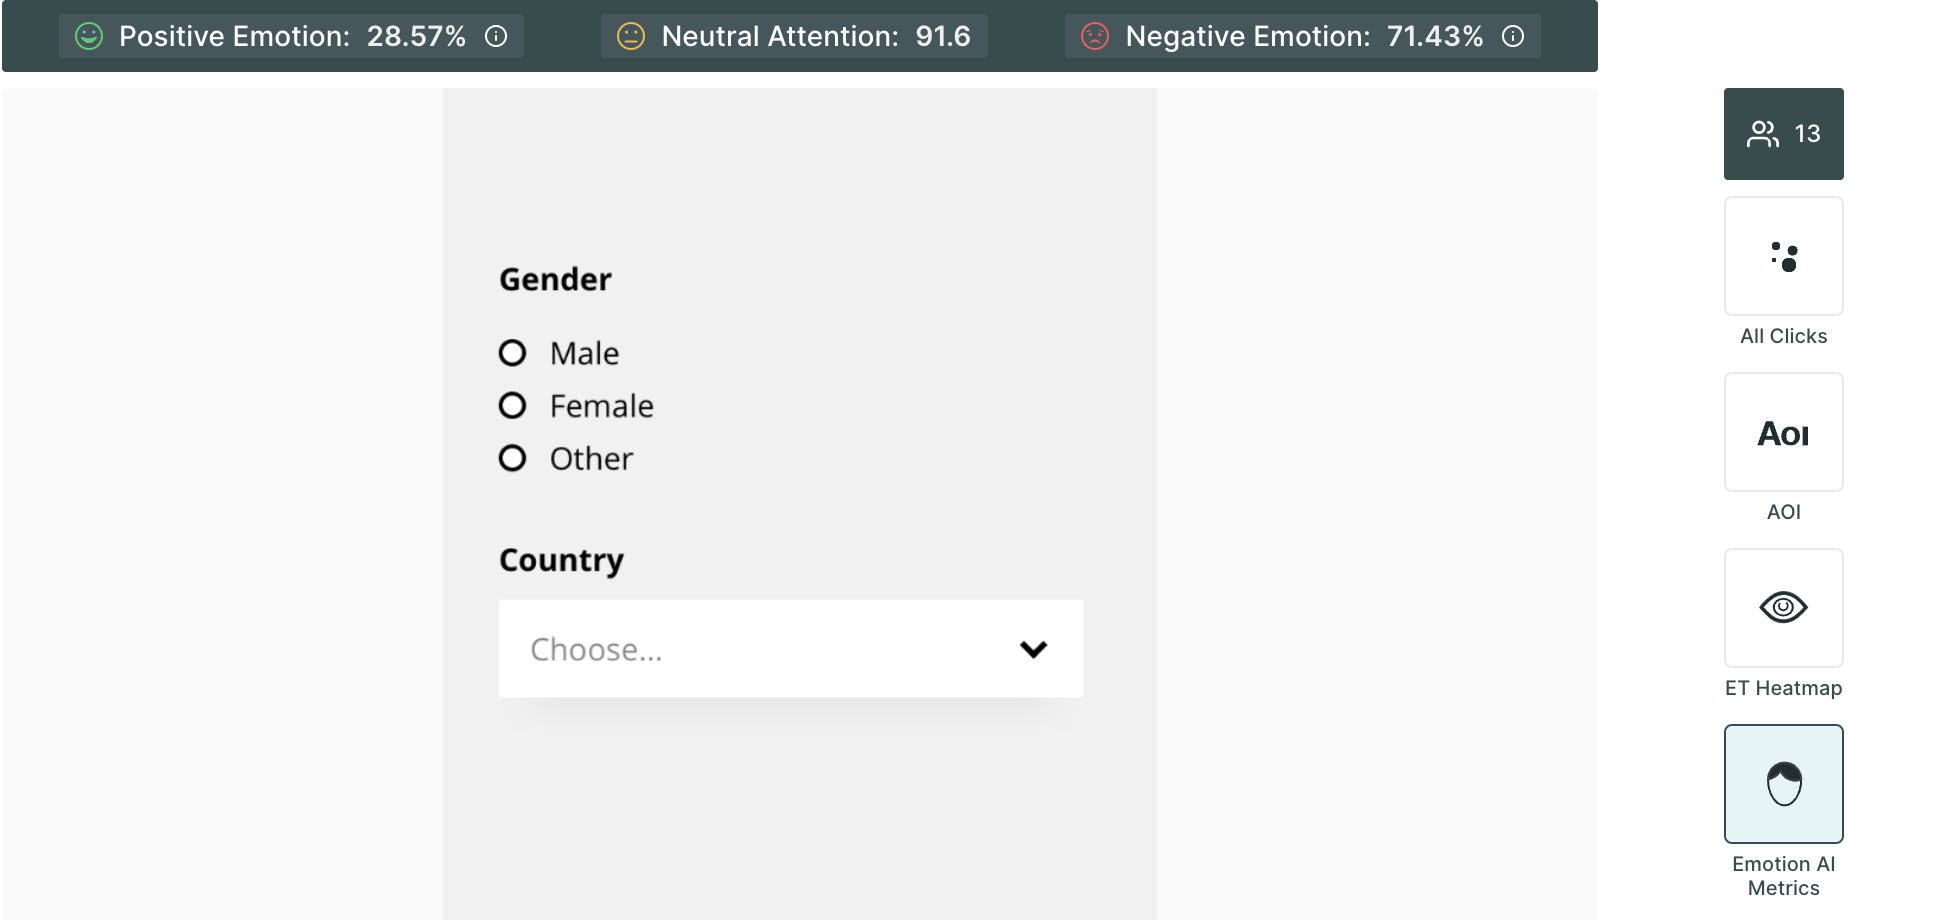
- Emotion AI Metrics: Dive into the emotional resonance of your content with metrics that categorize user responses as neutral, positive, or negative, allowing you to gauge the emotional impact of your design or content.
Example
Suppose you are an e-commerce business looking to optimize your product page layout for better conversion rates. Specifically, you want to compare two different variations of the "Add to Cart" button to determine which design yields higher user engagement and click-through rates.
Step 1: Set Up the Test
In Qatalyst, set up the A/B test by uploading the two versions of the product page, each with a different design for the "Add to Cart" button. Ensure that only this specific element is changed while keeping the rest of the page consistent. This will help isolate the impact of the button design on user behaviour.
Qatalyst provides you with the ability to enable technologies like eye tracking, facial coding, and mouse tracking. These technologies can be used to collect valuable data about how users interact with your website or design.
Step 2: Create Questions around the Test
Now, add questions based on the information you want to gather from respondents. Consider using open-ended questions to gather qualitative feedback that can provide deeper insights.
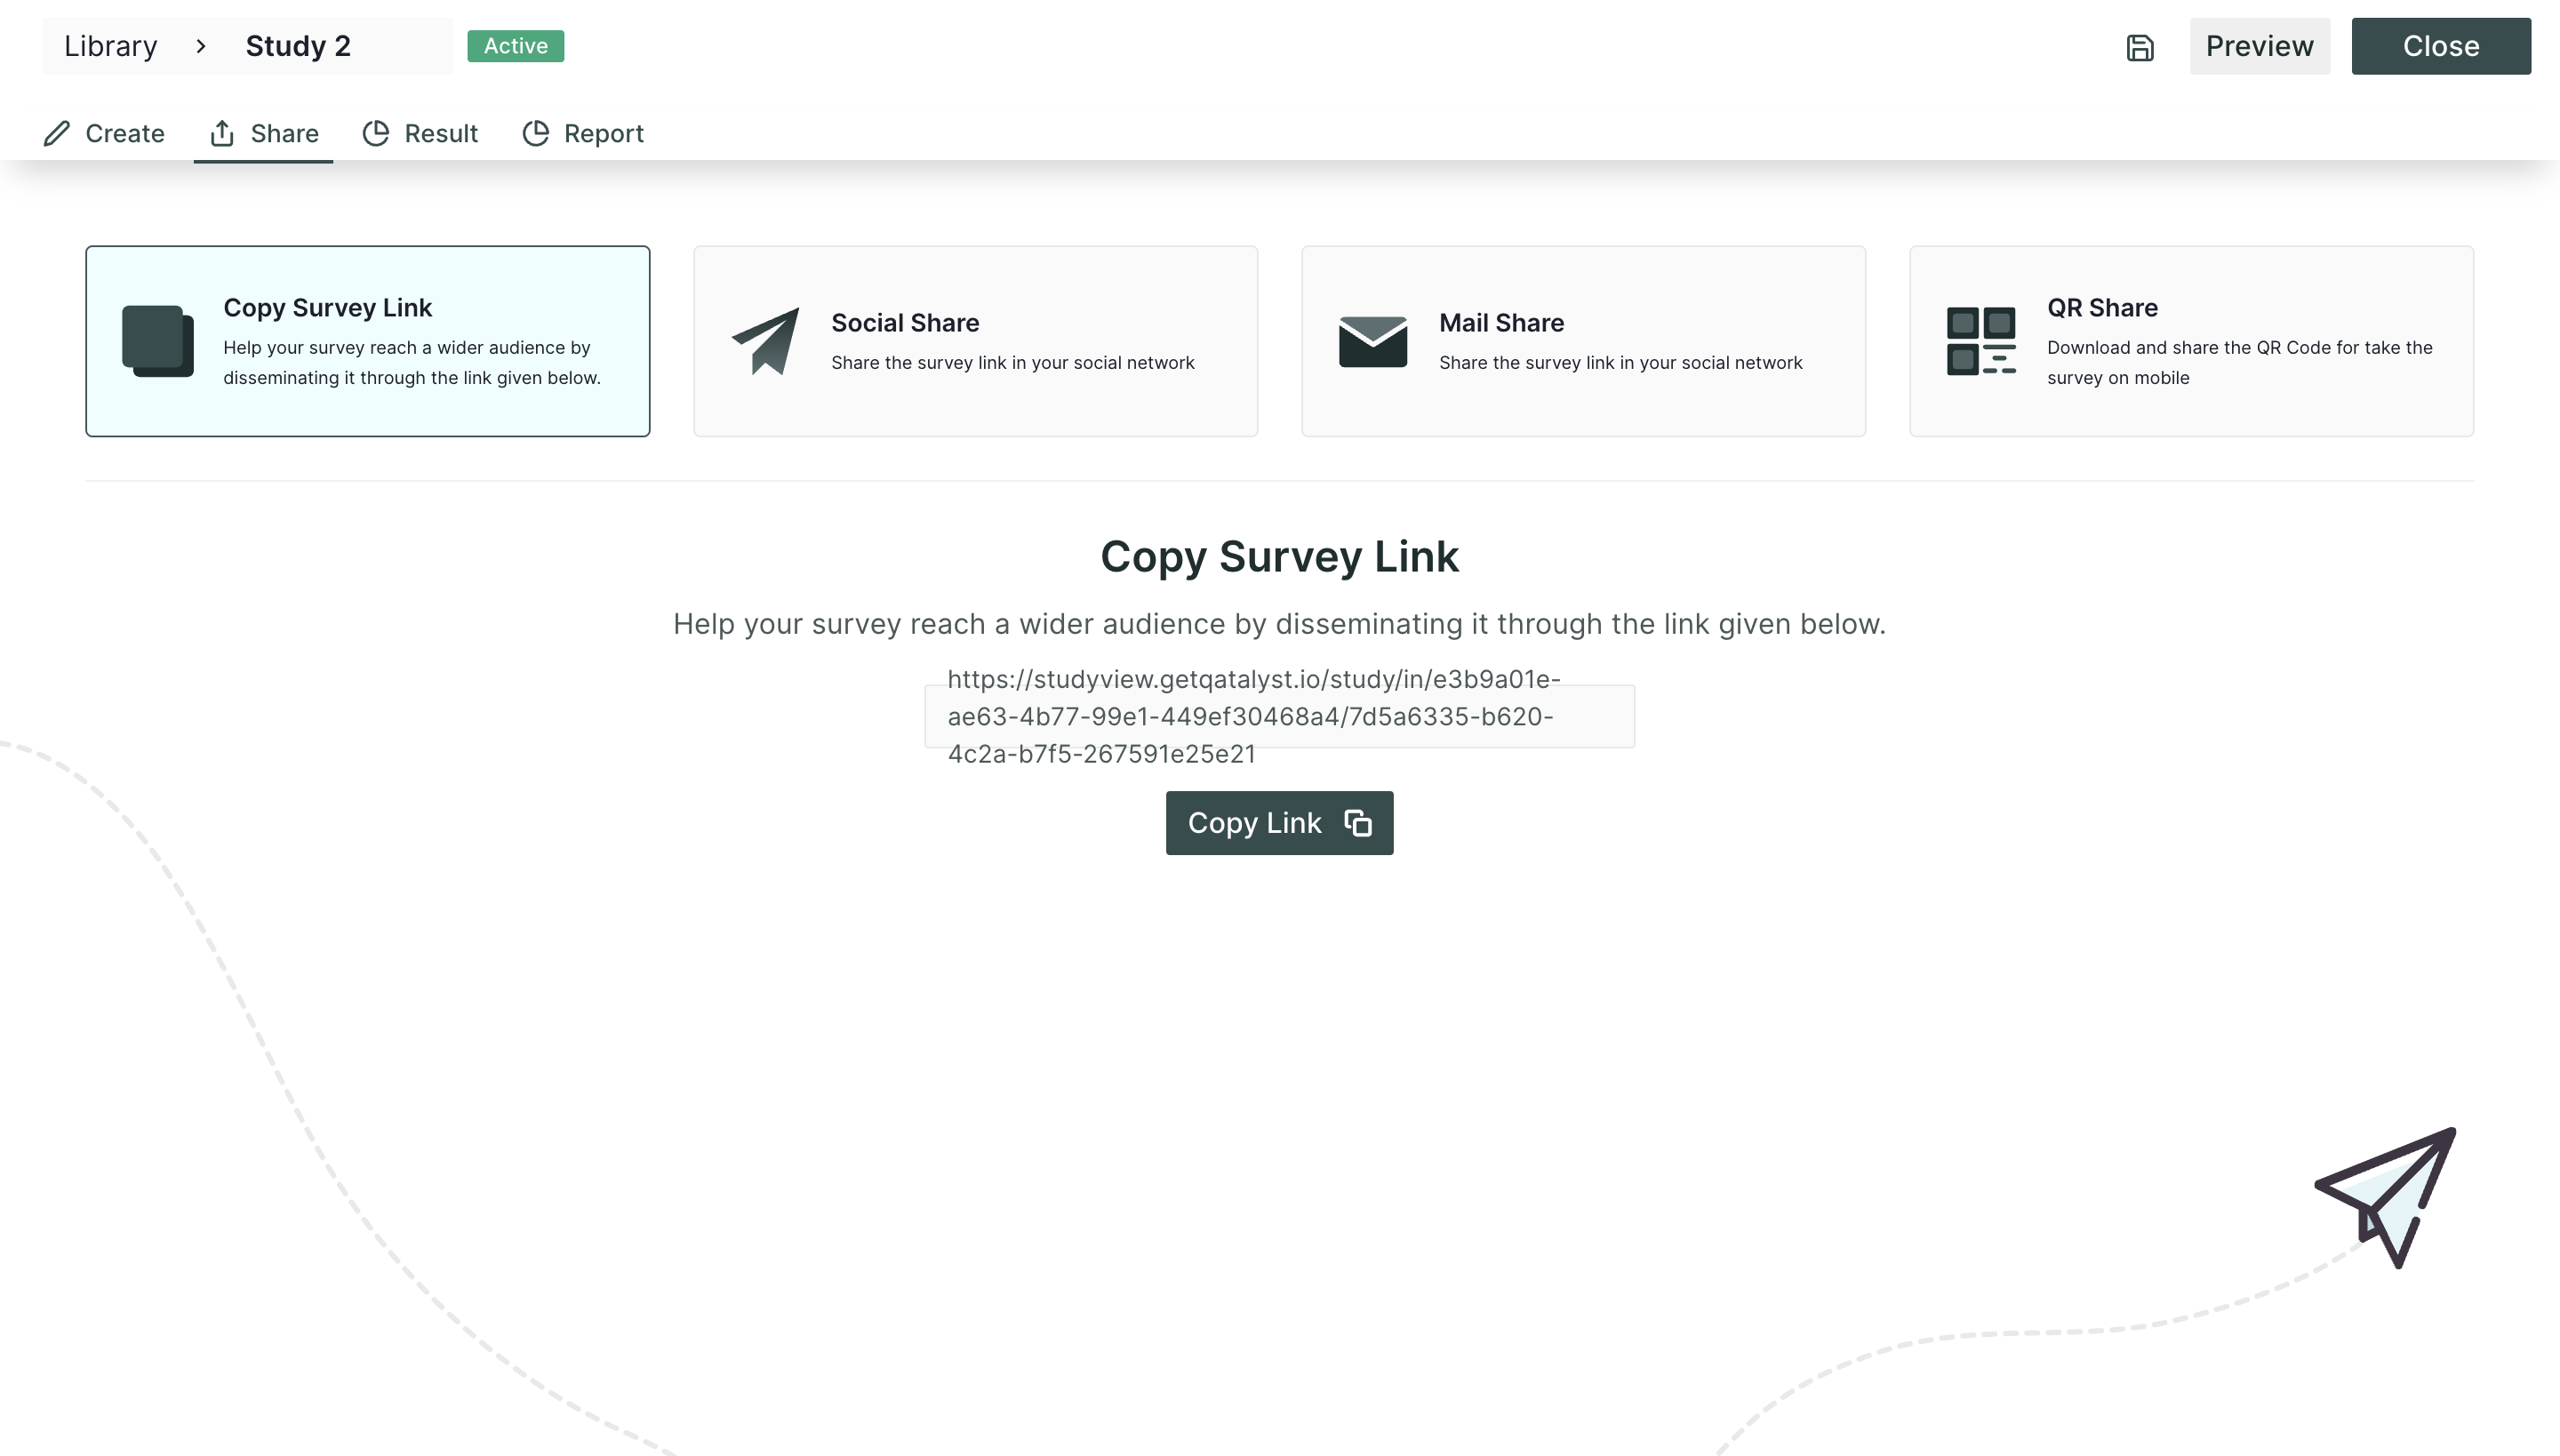
Step 3: Publish the test and share
Now that your test is ready, it’s time to share the test with the participants.
Step 4: Analyze the Result
After all, participants have completed the testing process. It is time to delve into the analytics and examine their responses to assess the success of your test.
In Qatalyst, you will separate the results for the question blocks added and the research blocks. If you have enabled the technology of tracking, you will get the metrics accordingly.
A/B testing with Qatalyst empowers you to make data-driven decisions about design changes, enabling continuous optimization and improvement of your product pages to maximize conversions and enhance user experience.