First Click Test in Qatalyst
A first-click test is a usability research method used to evaluate how easy it is for users to complete a specific task on a website, app, or any interface with a visual component. It essentially gauges how intuitive the design is by analyzing a user's initial click towards achieving a goal.
Create a FIRST CLICK Test👩🏻💻
To create a 5-second test, follow these simple steps:
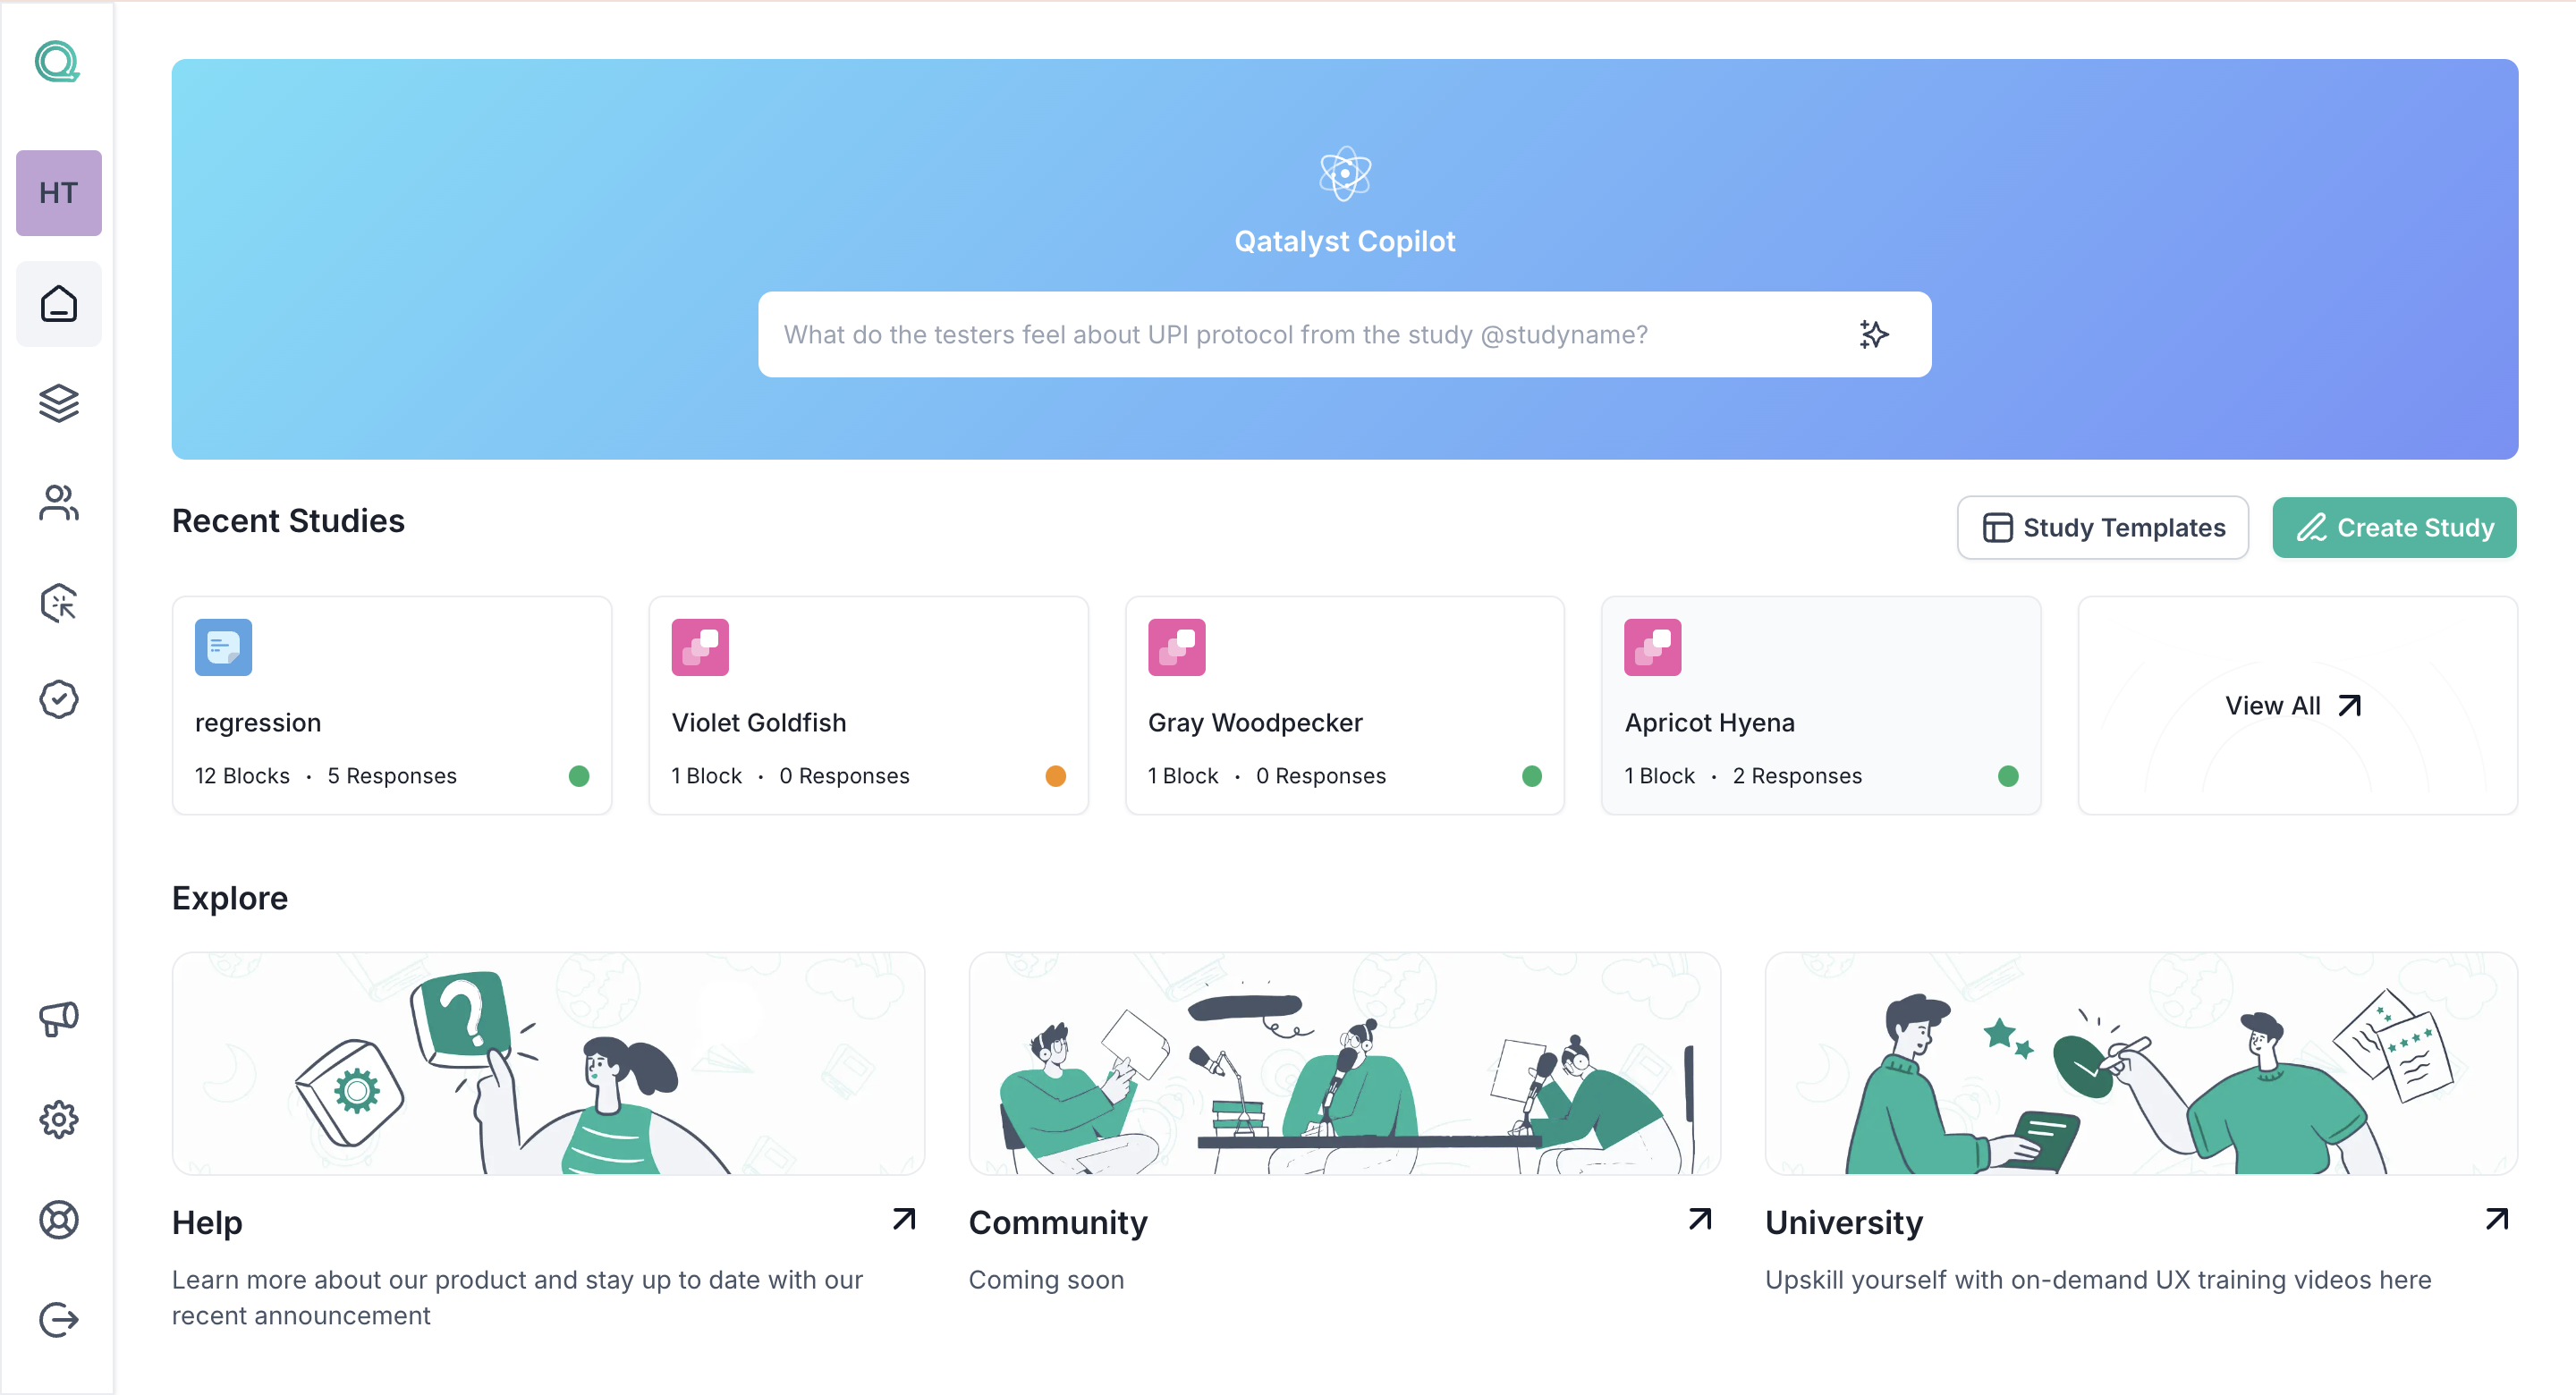
Step 1: Log in to your Qatalyst account, which will direct you to the dashboard. From the dashboard, click on the "Create Study" button to initiate the process of creating a new study.
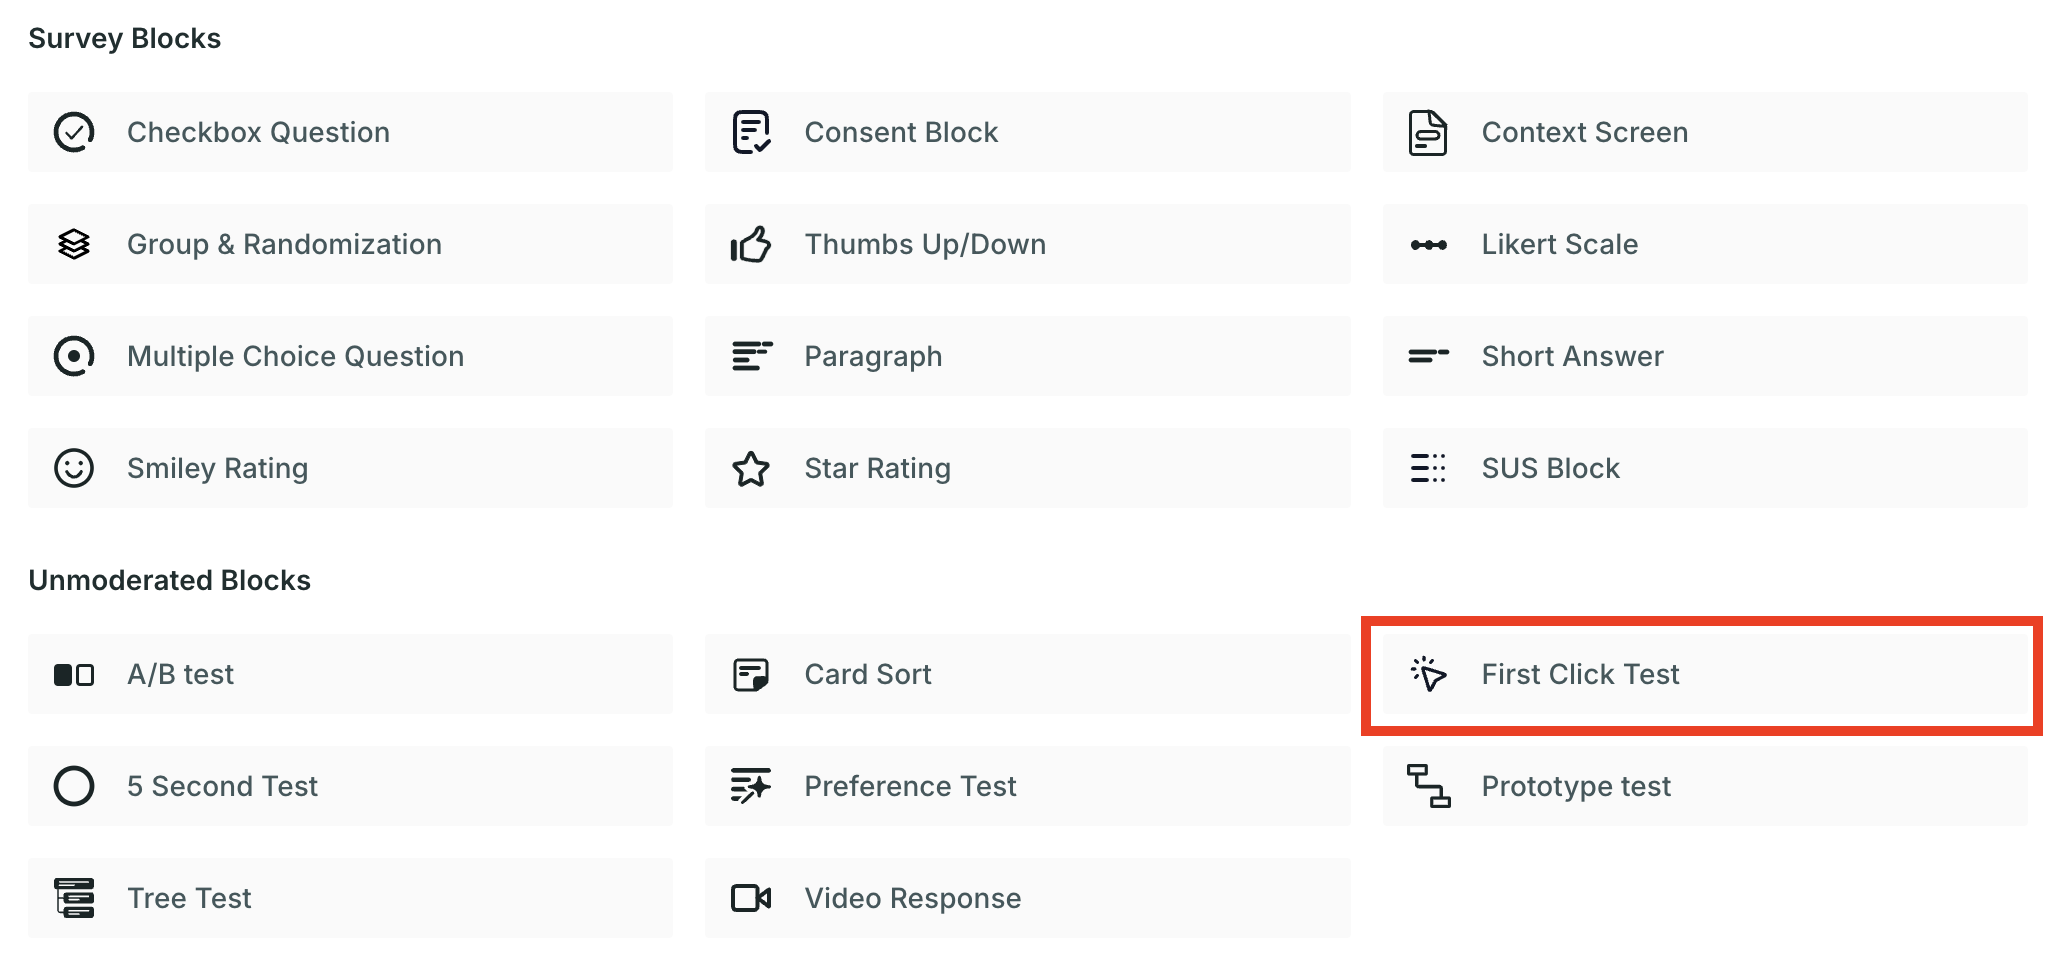
Step 2: Once in the study creation interface, locate the "+" button and click on it to add a new block. From the list of options that appear, select the "First Click Test".
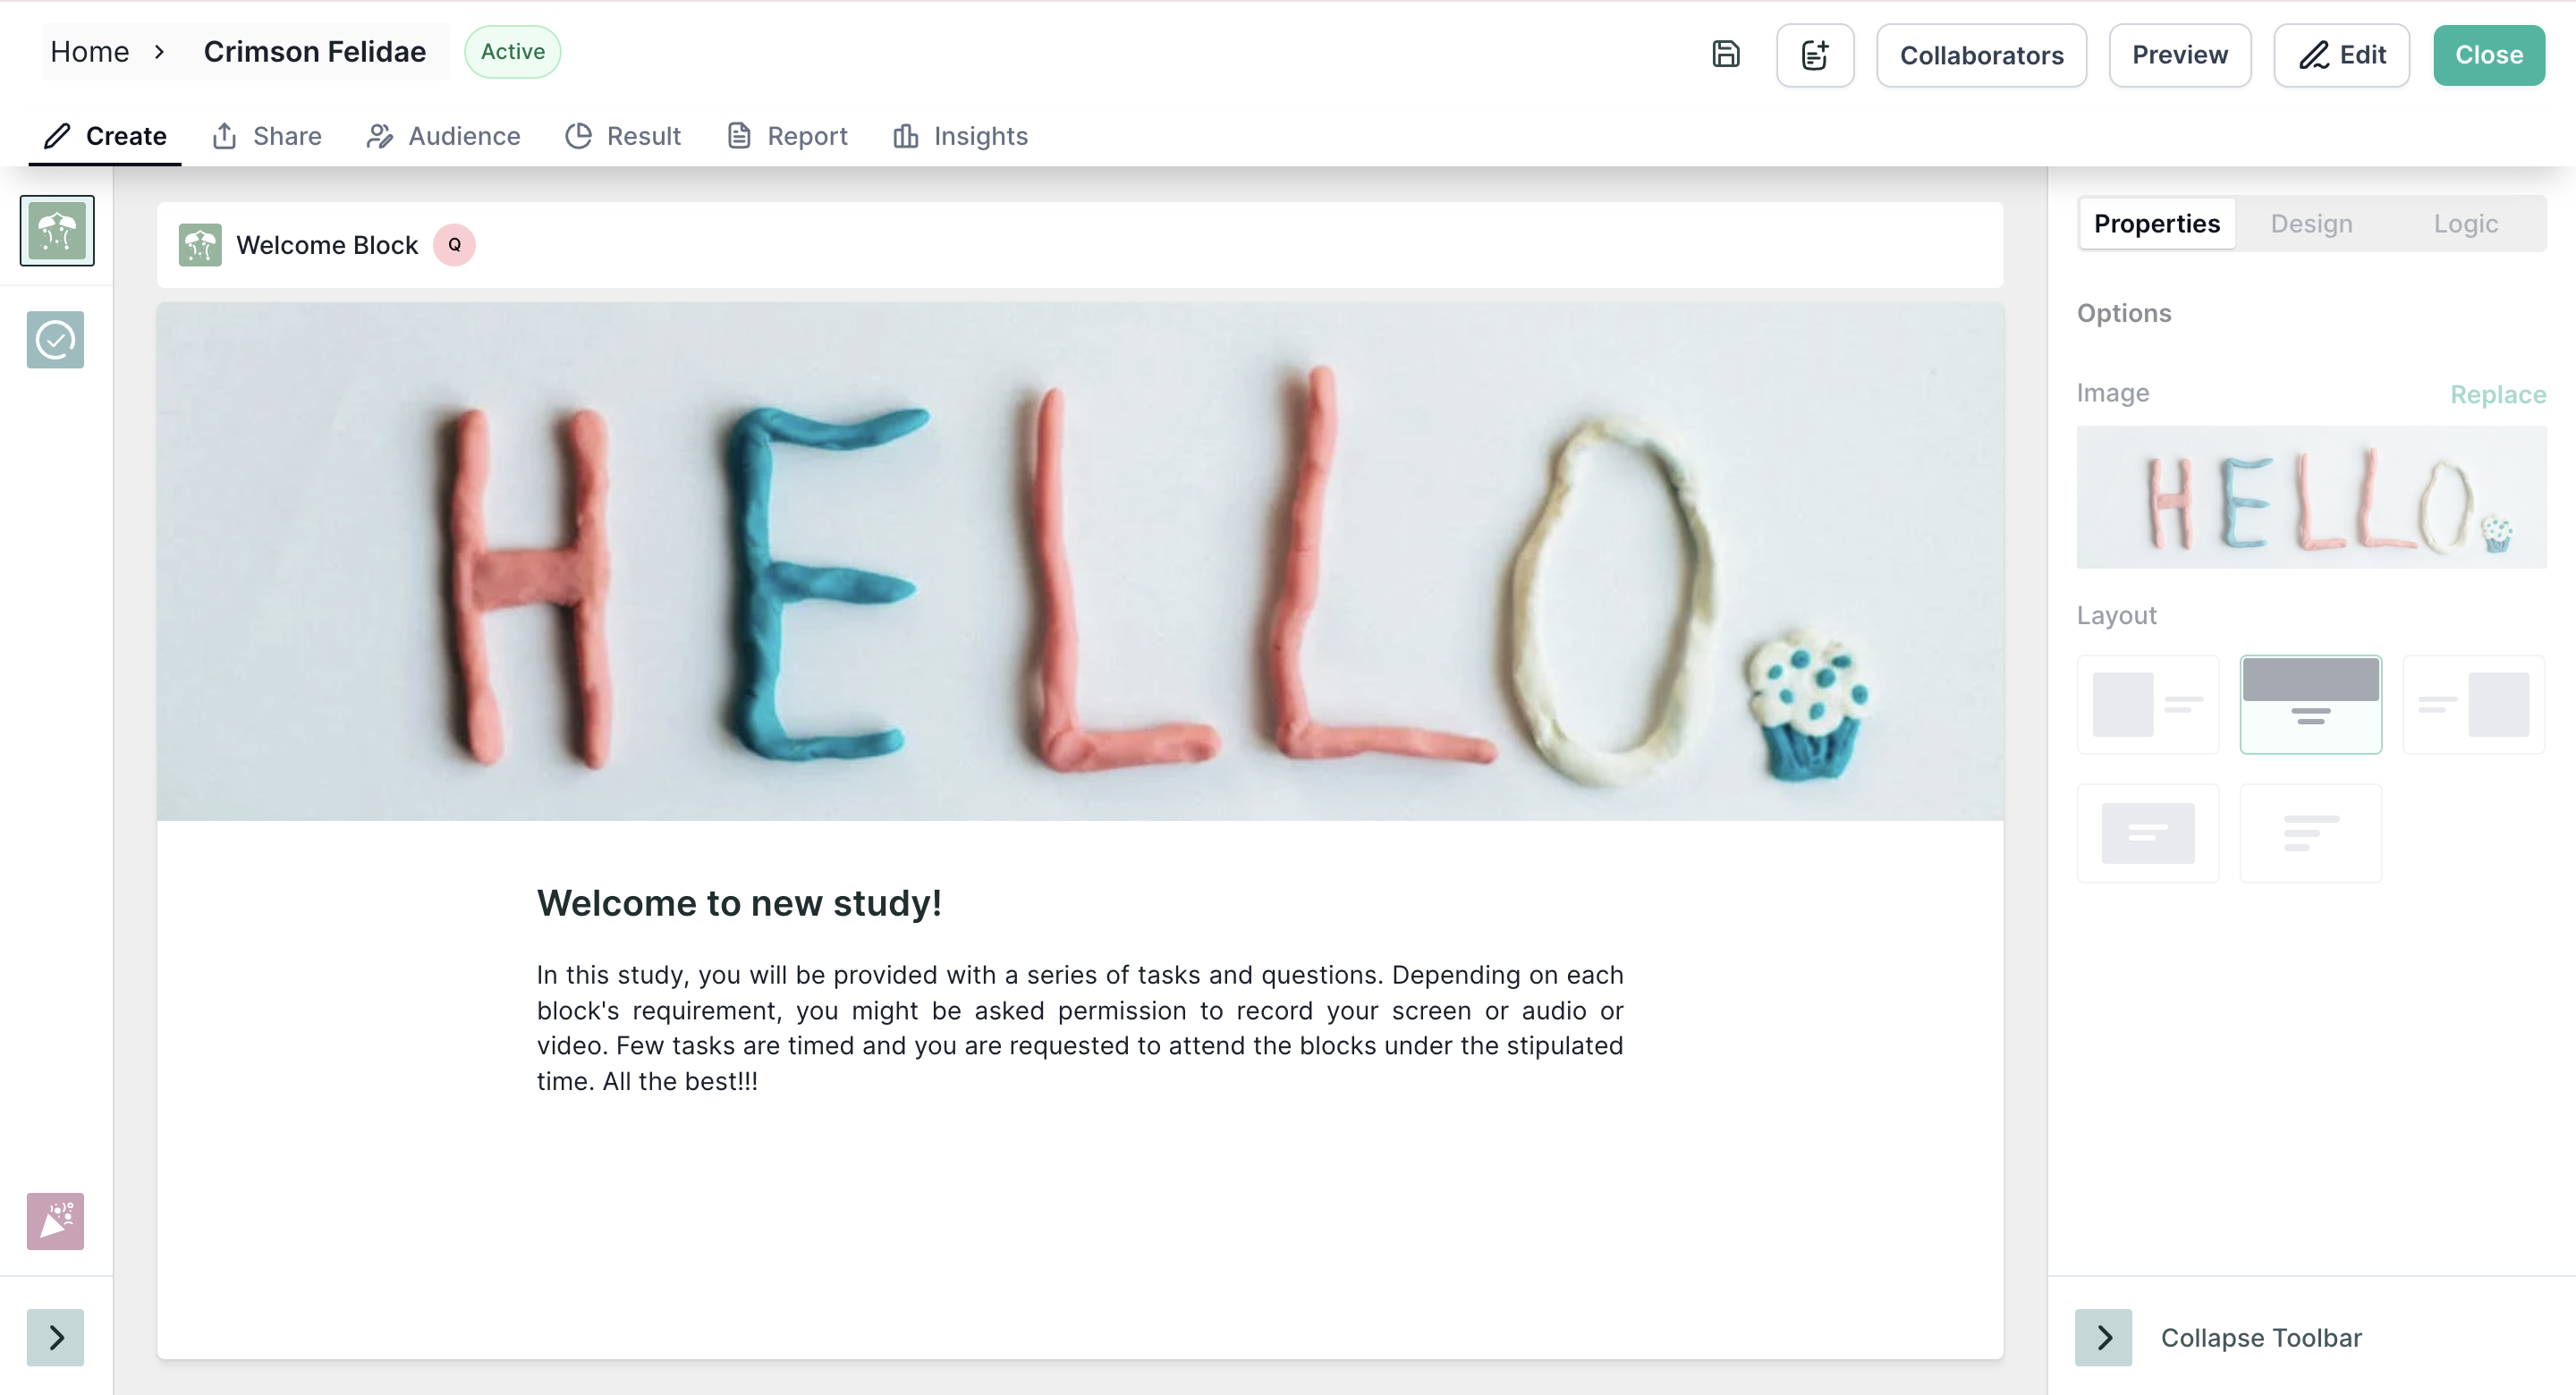
Properties
- Number of Clicks Allowed: You can give the number of maximum clicks a user can make in the interface, only their last click will be taken into account.
- Image Dimension:
- Fit to Screen: In this setting, the image is displayed in such a way that it completely fits within the boundaries of the screen, regardless of its original dimensions. Users can view the entire image without the need to scroll vertically or horizontally.
- Fit to Width: The image is scaled to cover the full width of the screen while maintaining its original aspect ratio. If the dimensions of the image exceed the width of the screen, users can scroll vertically to view the portions of the image that extend beyond the visible area.
- Fit to Height: In this configuration, the height of the image is adjusted to fit the screen while preserving its original width. If the width of the image exceeds the screen width, users can scroll horizontally to explore the entire image.
- Mandatory Test: Taking this test is mandatory; the respondent will not be able to move to another question without taking this test.
Technology
- Mouse Tracking: Mouse tracking is a technology that records the clicks of the users on the screen as they interact with the design.
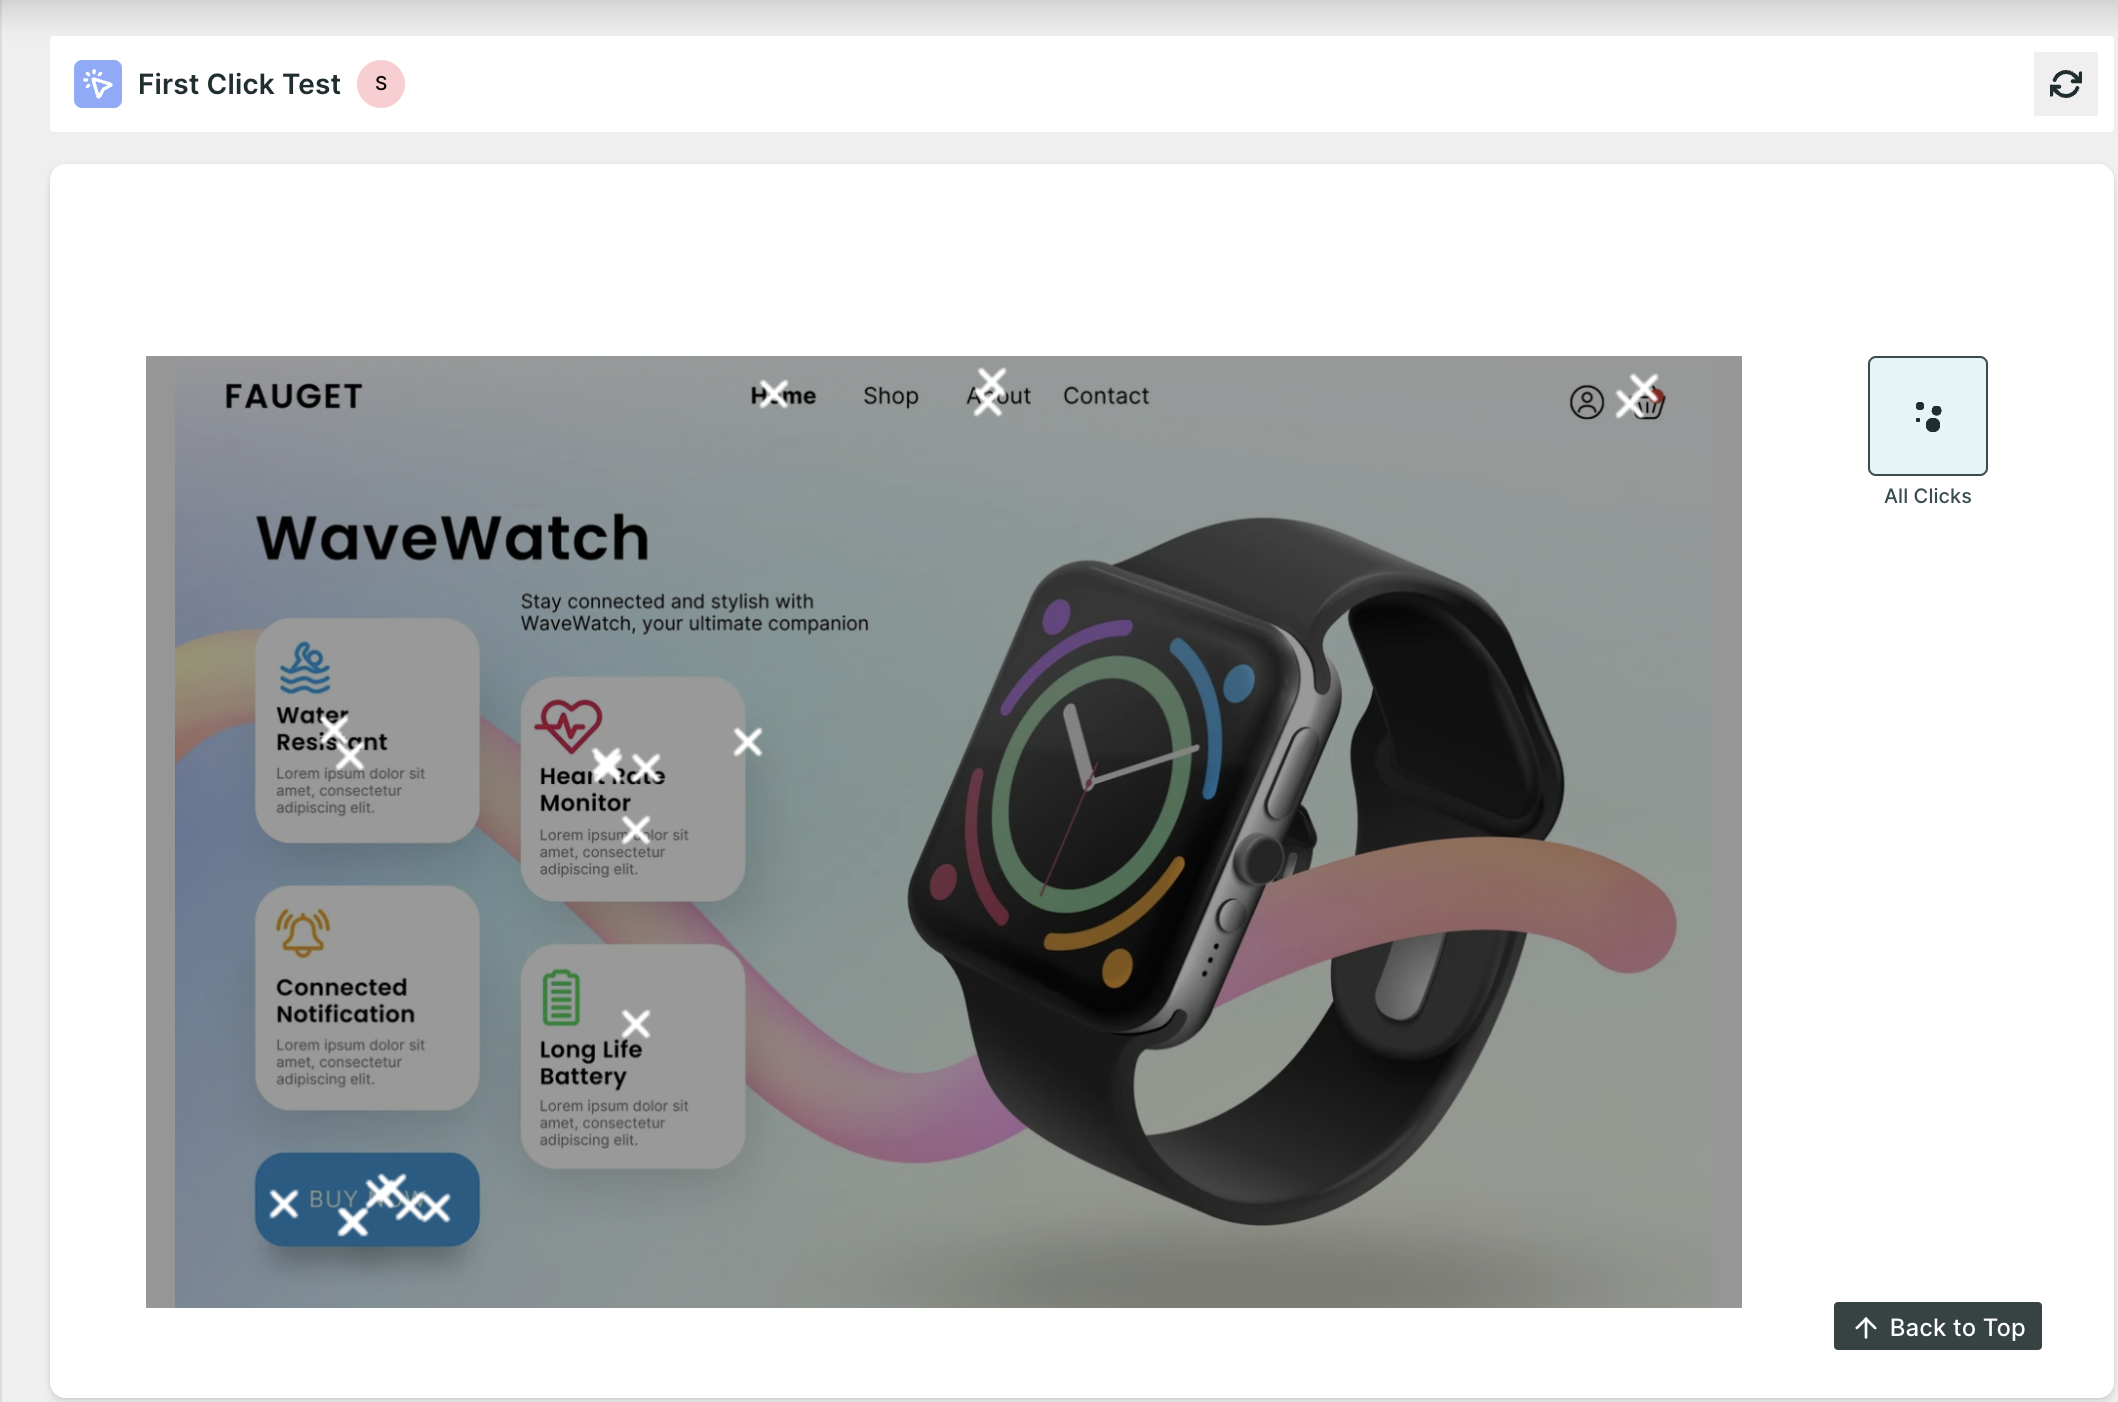
Result View 📊
Once the respondents have taken the test, you will be able to see the analytics in the result section.
In the summary section, you will find the following information:
- Respondents: Number of people who initiated the test block.
- Skip: The Number of people who choose to skip the block.
- Drop-off: Number of people who have not moved to the next block.
- Bounce Rate: ((Dropoff + Skip)/ Number of Responses)*100 . (In Percentage)
Based on the technology selected, you will find the following metrics :
- All clicks: All Clicks metrics provide insights on the clicks made by the respondents on the image. It gives a complete view of how users interact with the image. The size of a click depends on how many times respondents have clicked in that area. This helps us understand which parts of the picture are getting more attention from users.