Create and share Insights in Qatalyst
Overview
The insights feature in Qatalyst is a powerful tool that allows you to gather and organize your findings from the research in a clear and concise manner. With insights, you can create webpages that include text, images, and tables that highlight their key findings and observations. In this article, we will guide you through the process of creating and sharing highlights.
Steps
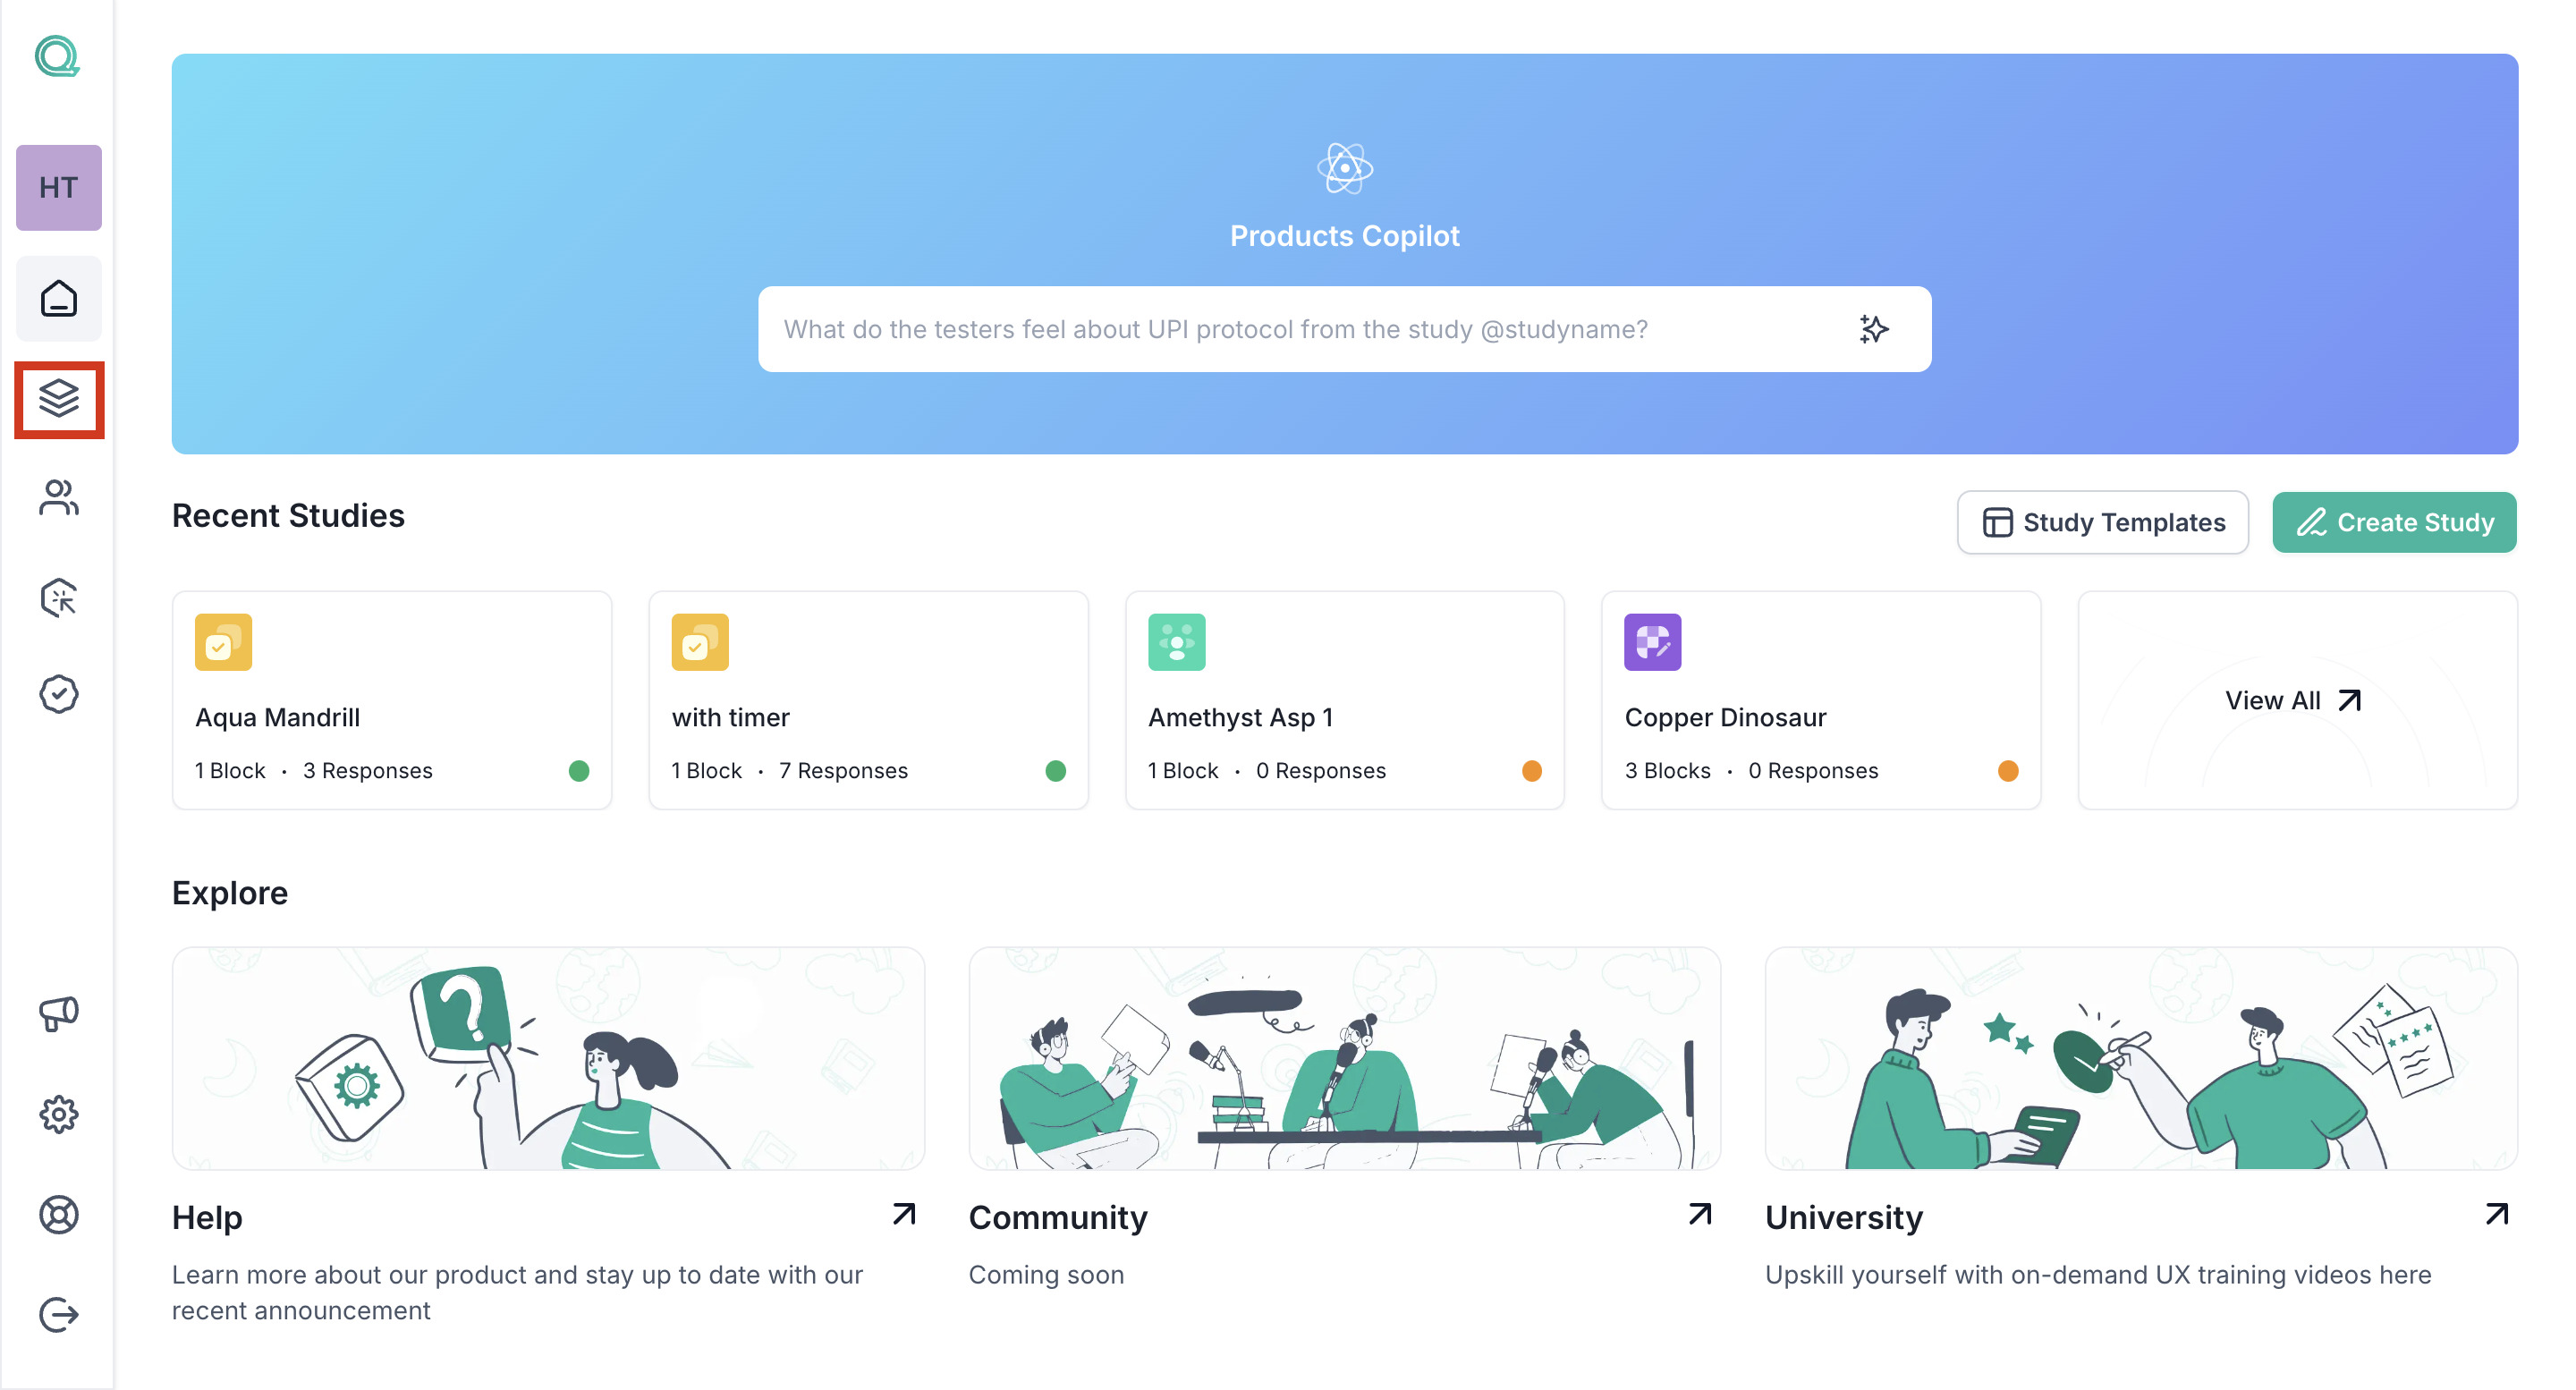
Step 1: Once you log into your Qatalyst account, you will be directed to the dashboard.
Step 2: From the navigation panel on the left-hand side, click on the "Library" icon.
Step 3: You will be taken to the library page; here, all the studies are available on the Qatalyst platform. To open the study, click on the study card, and the study will open.
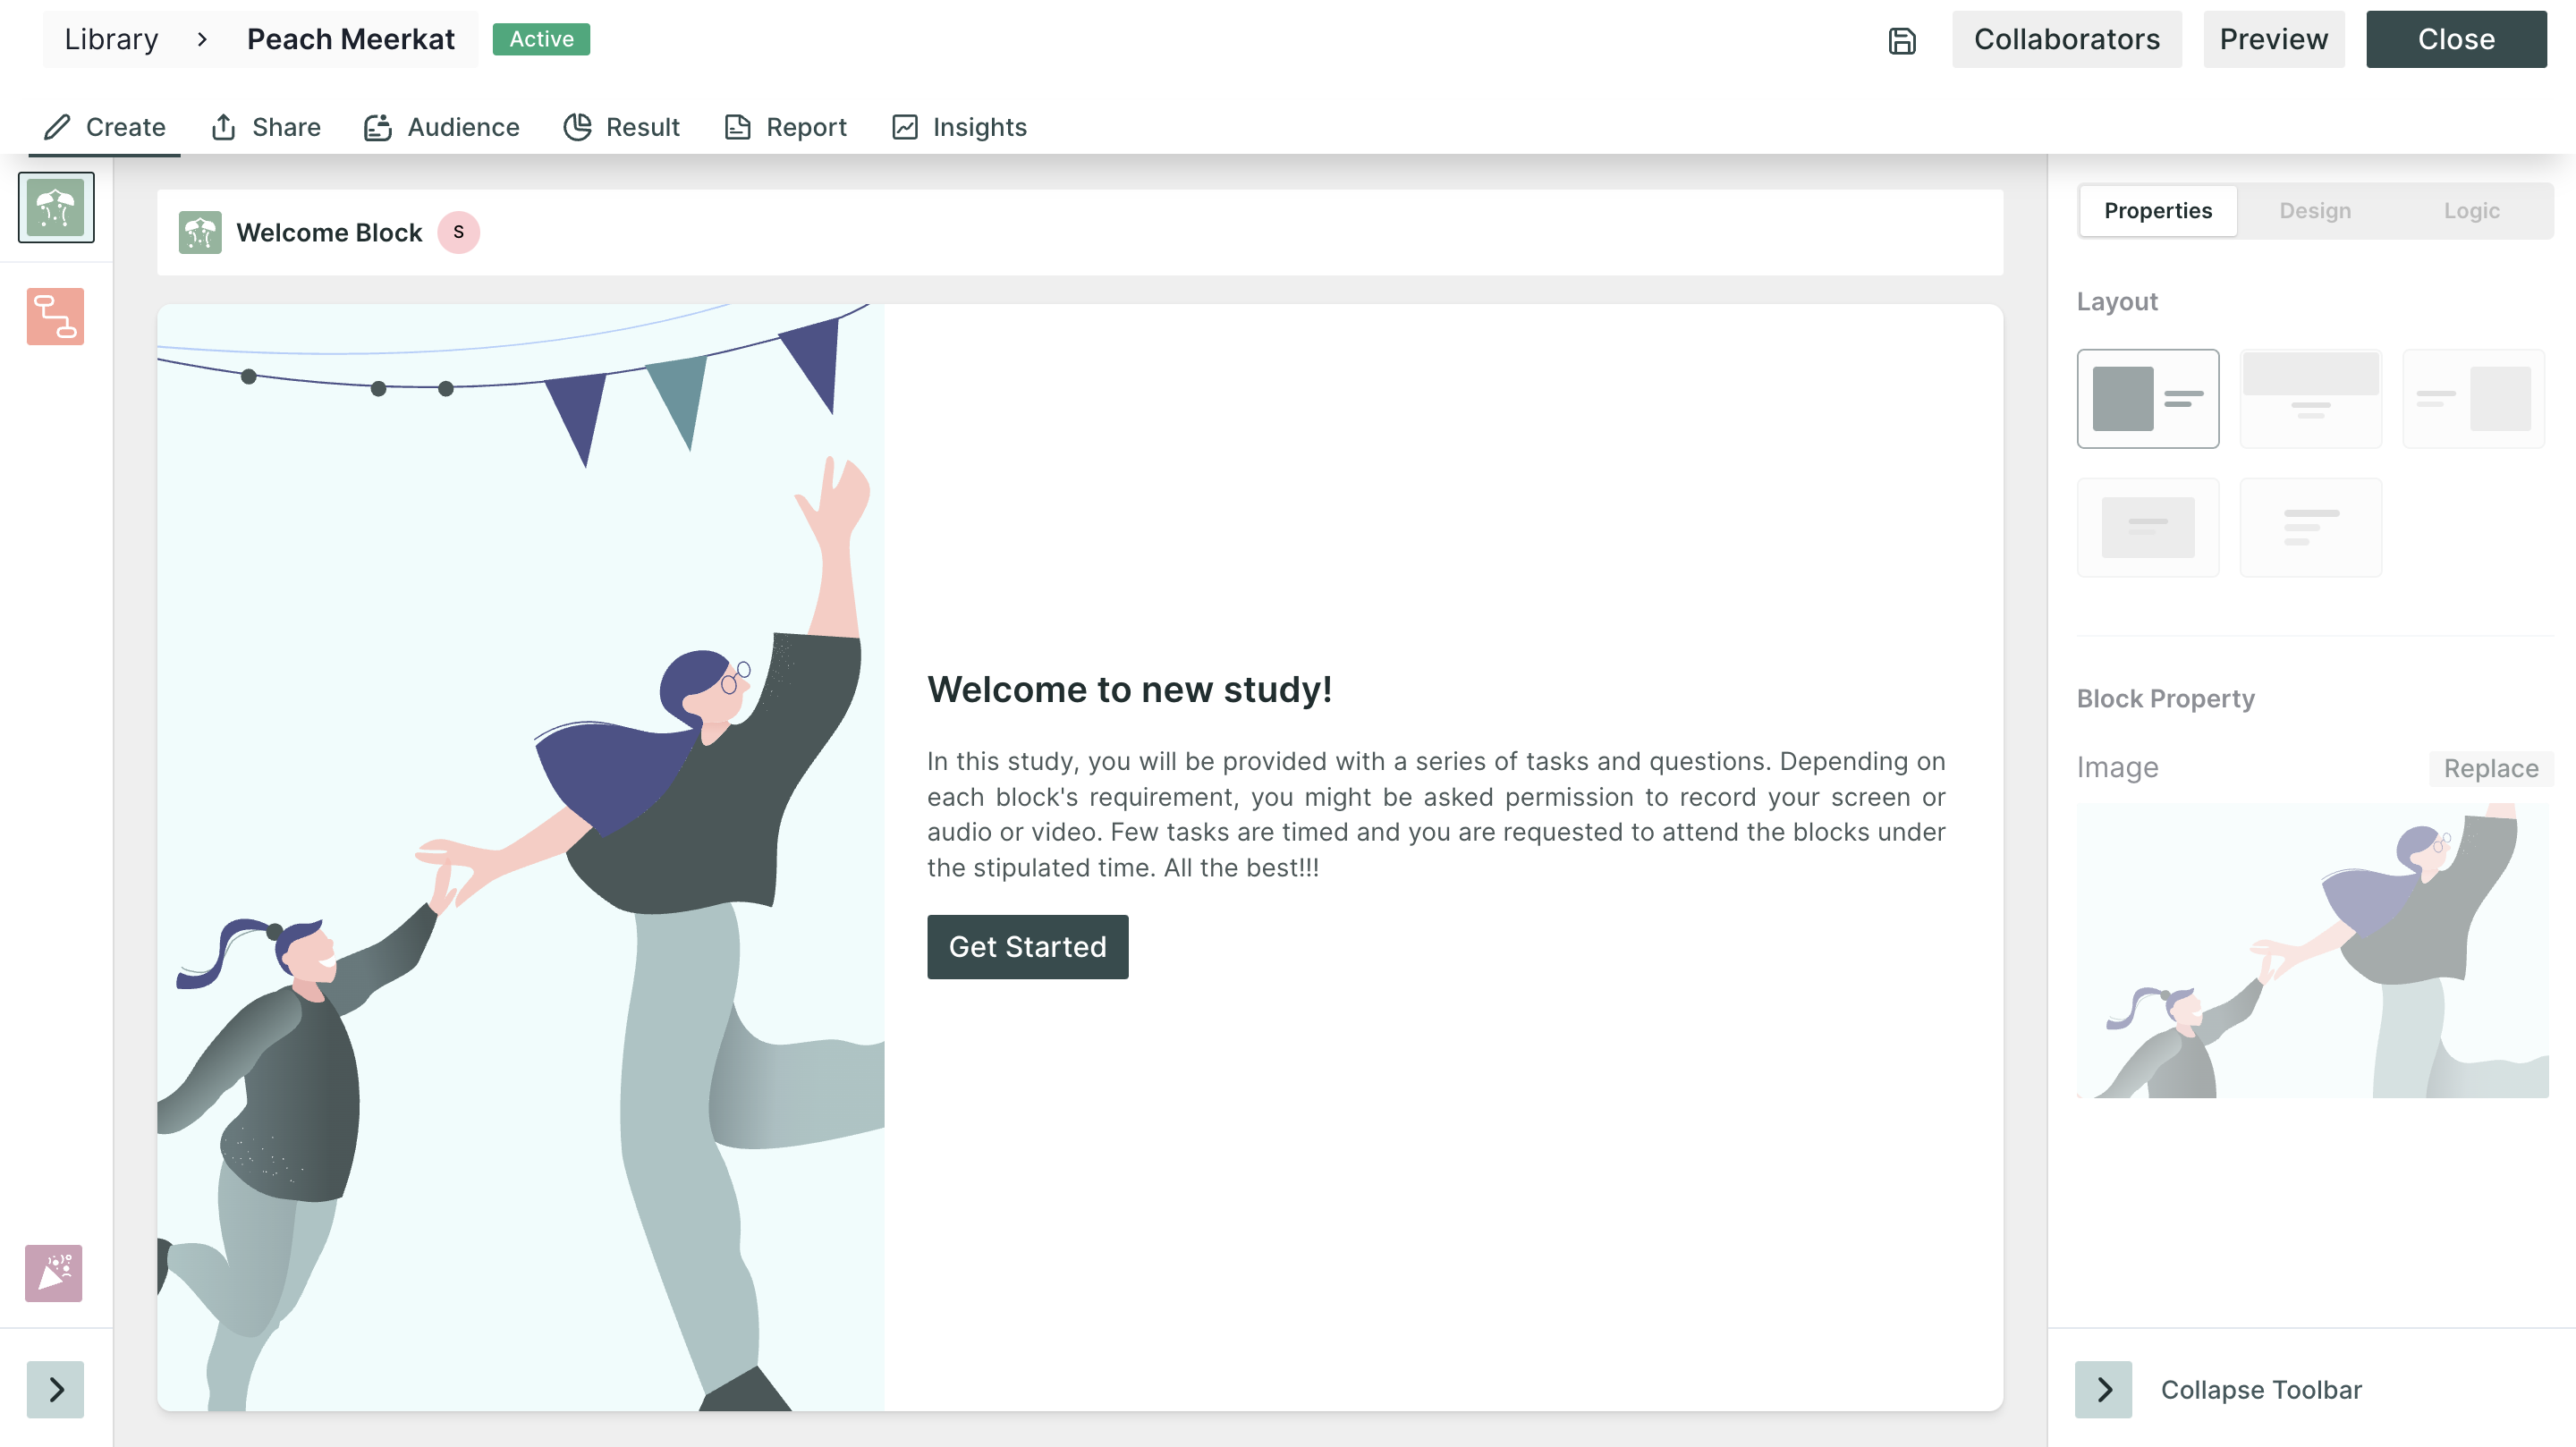
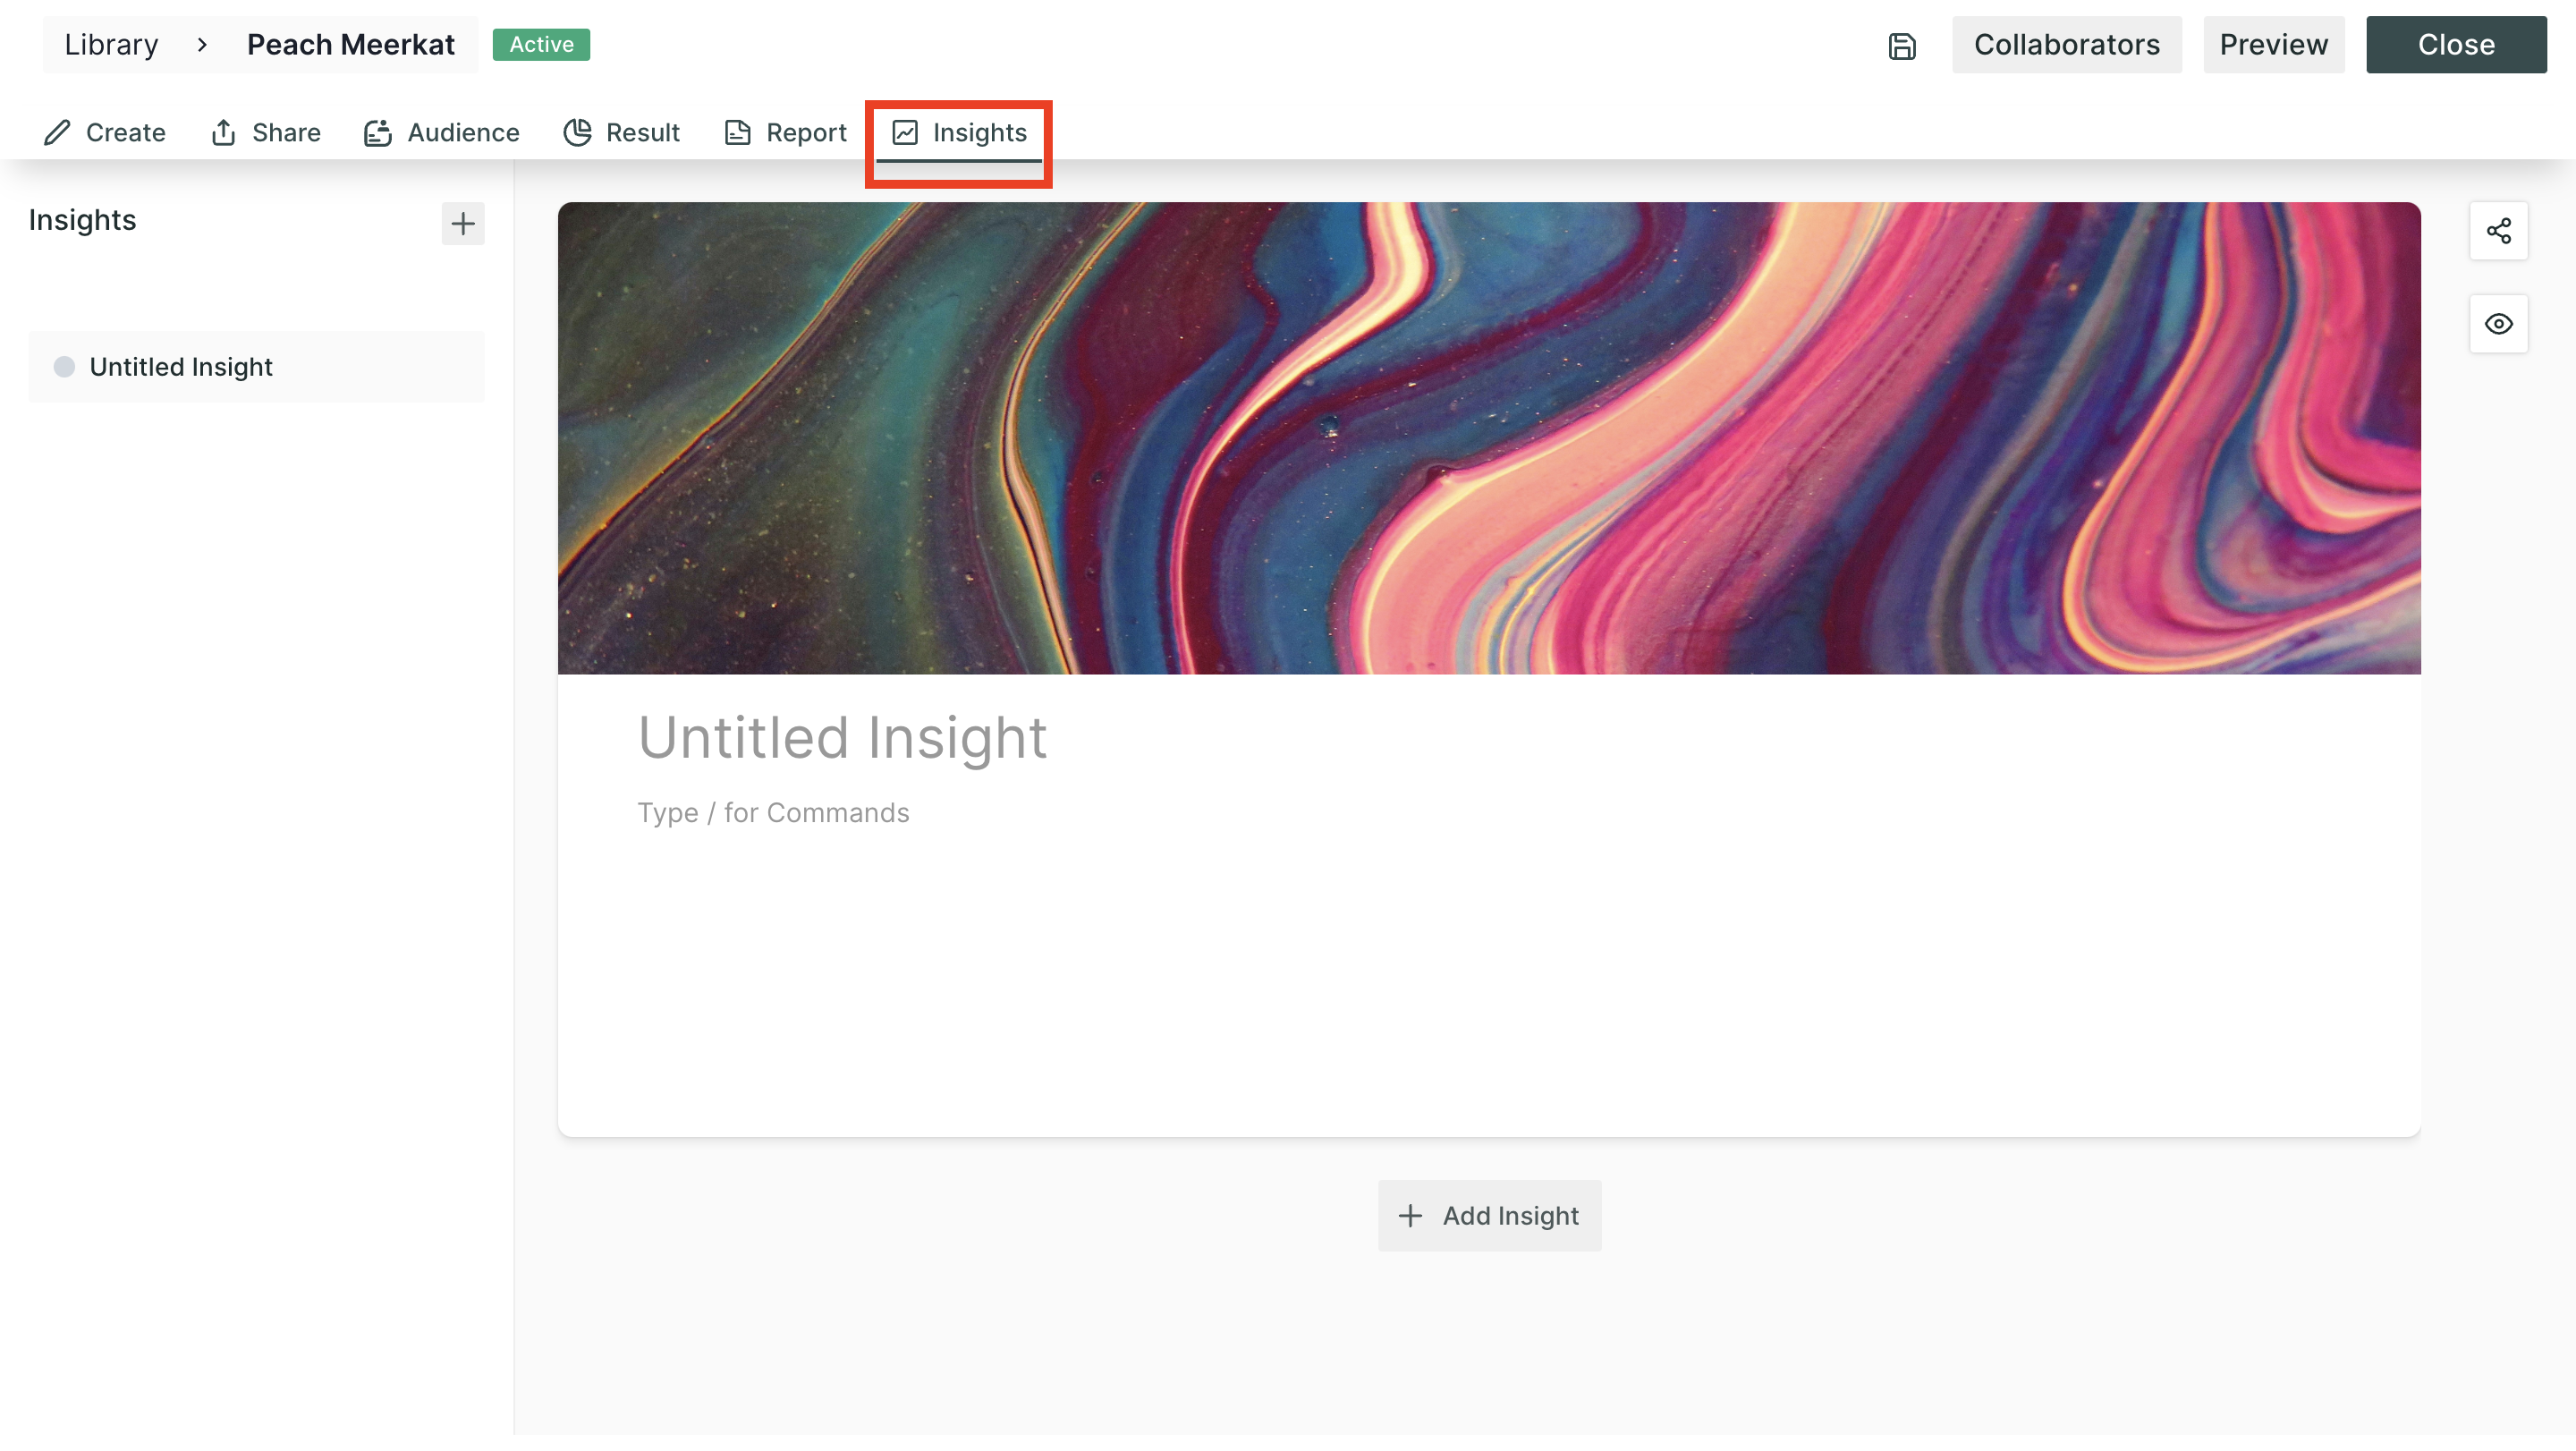
Step 4: Navigate to the Insights tab from the top navigation bar.
Adding Insights
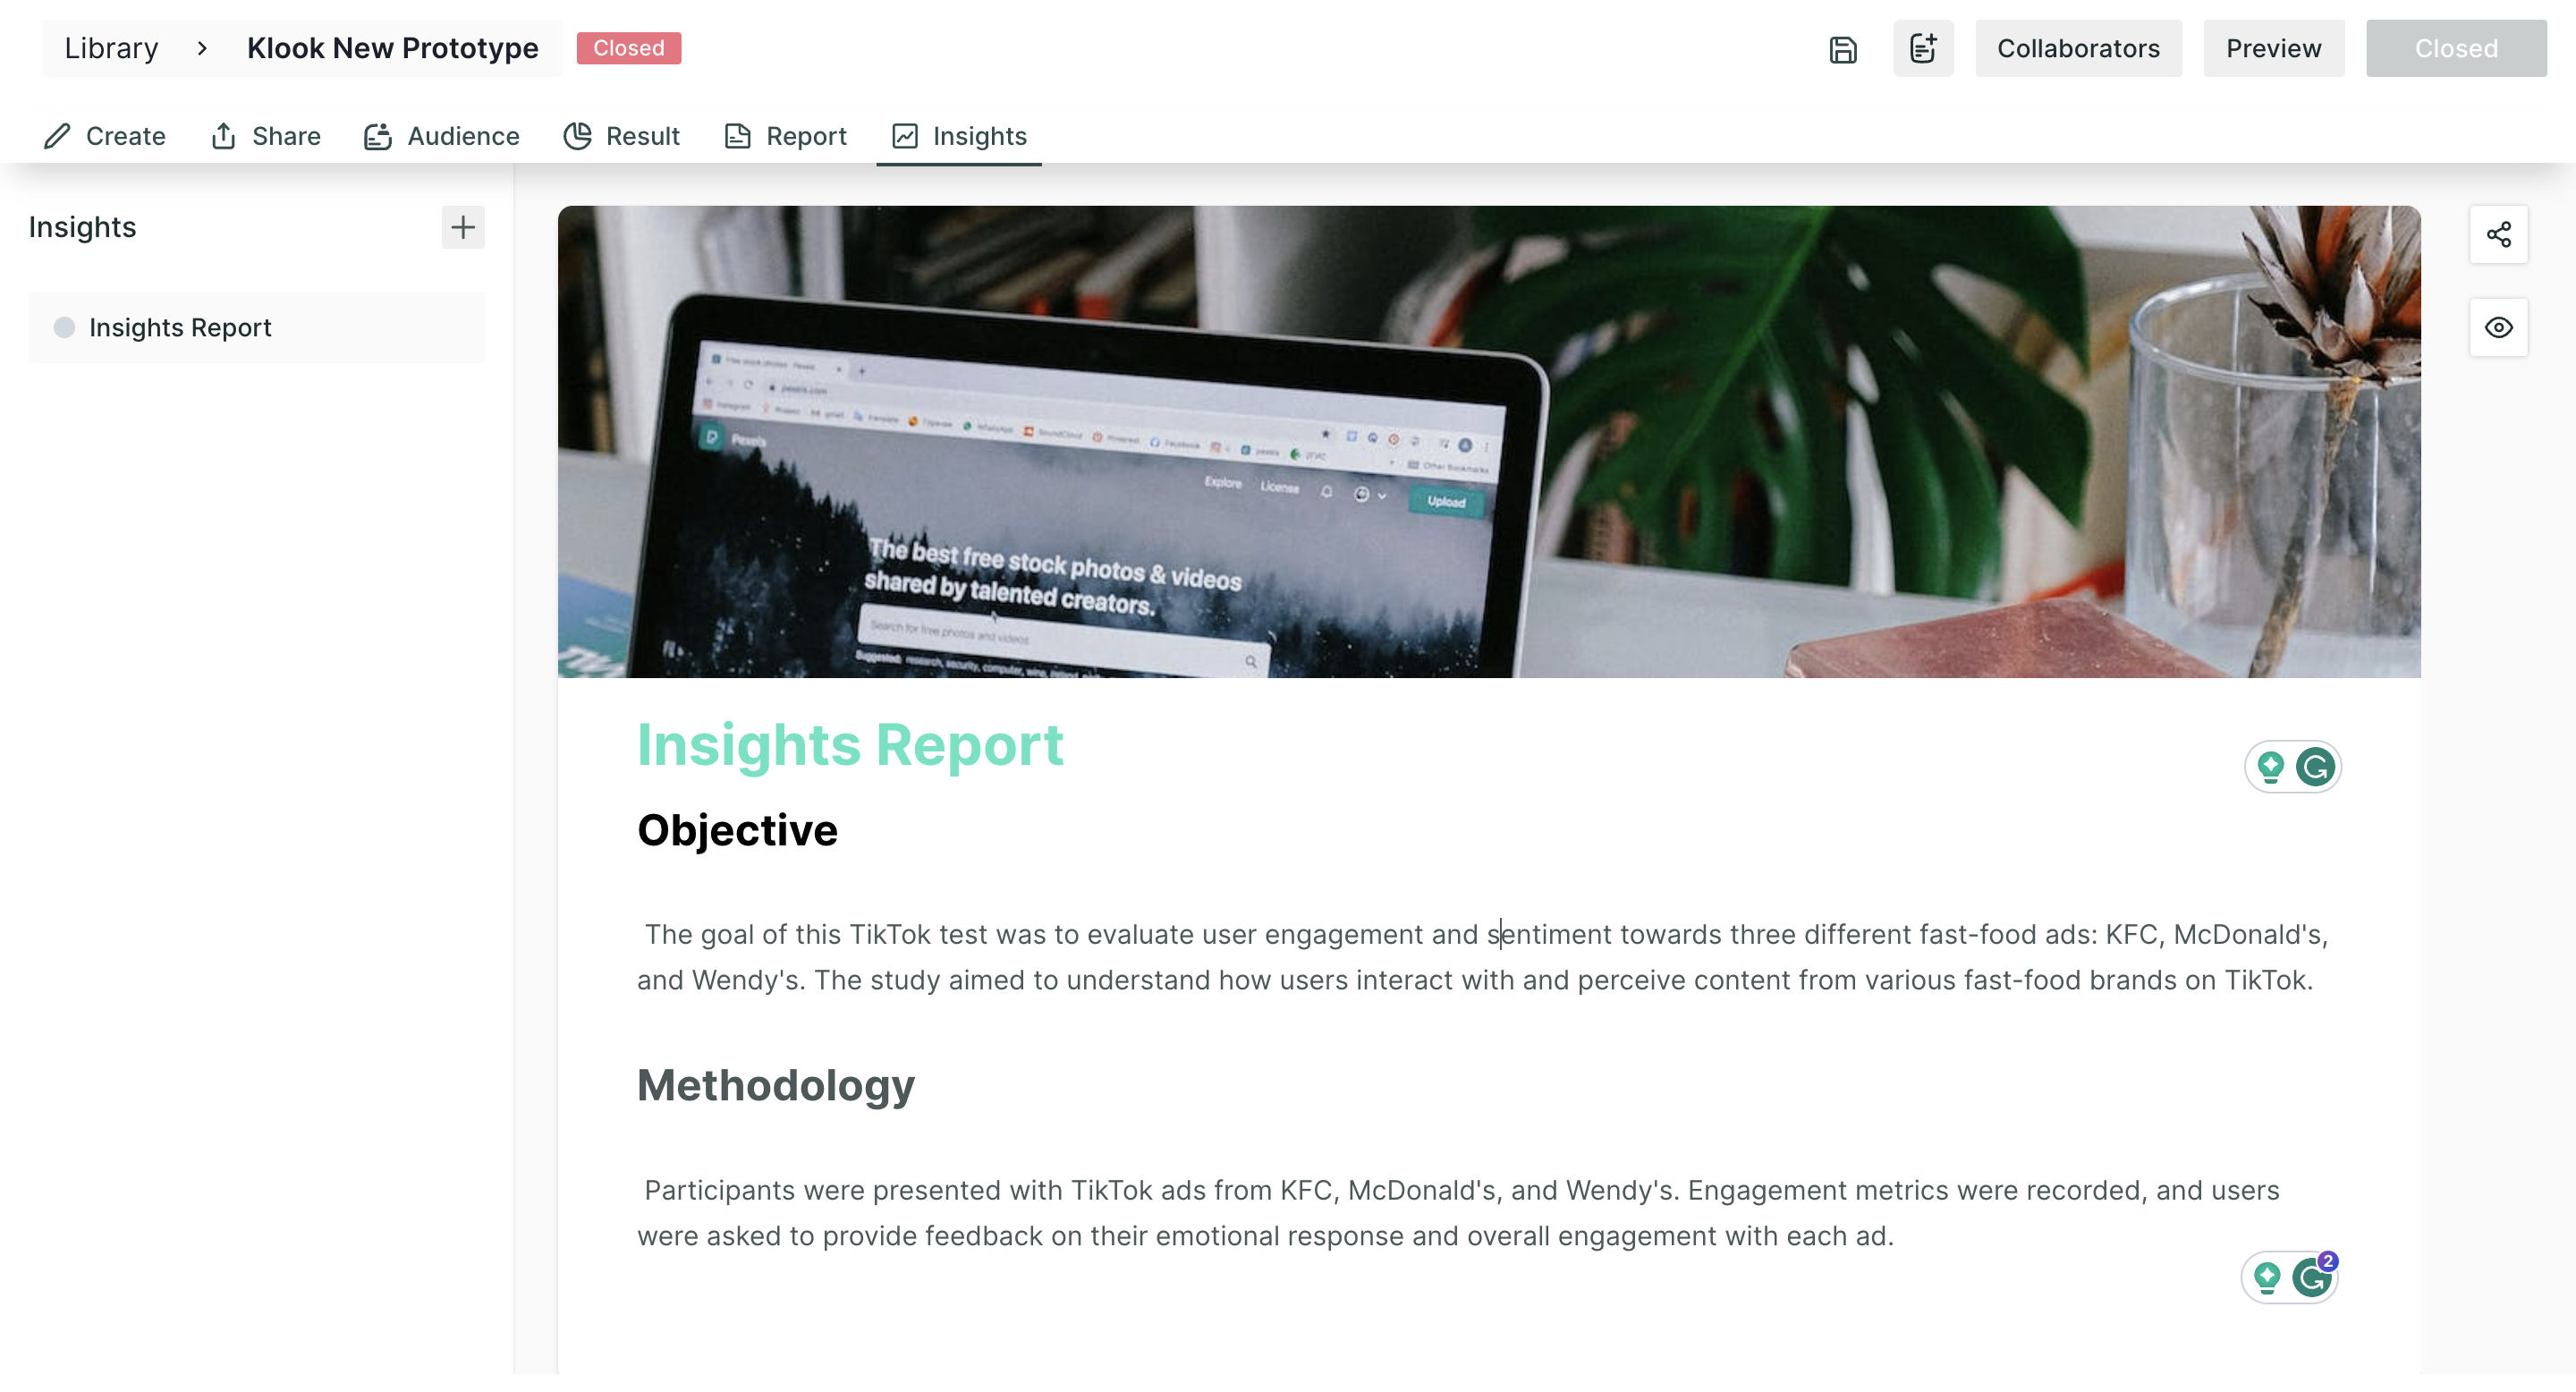
Step 5: You can update the following information:
- Title: give a title to your insight by adding text to the "Untitled Insight" placeholder.
- Cover image: This image will reflect at the top of the insight to make it more catchy. You can choose a background colour, a background image from the picture library, image from your local gallery.
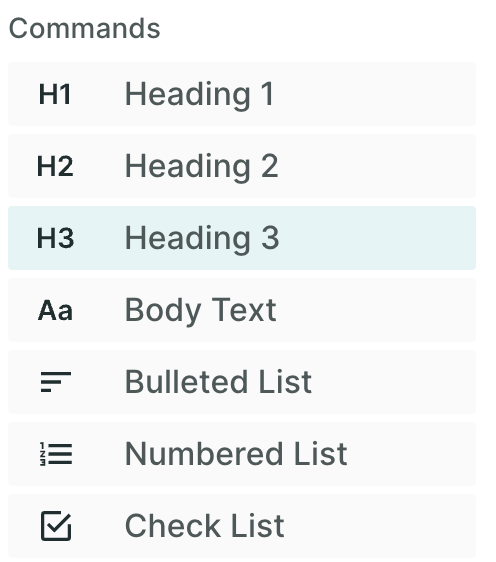
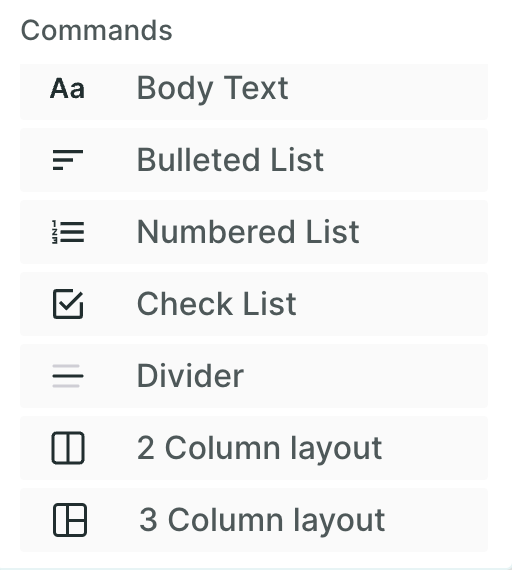
- / Command: Using this command, you can add different styles of text, tables, lists, dividers etc.
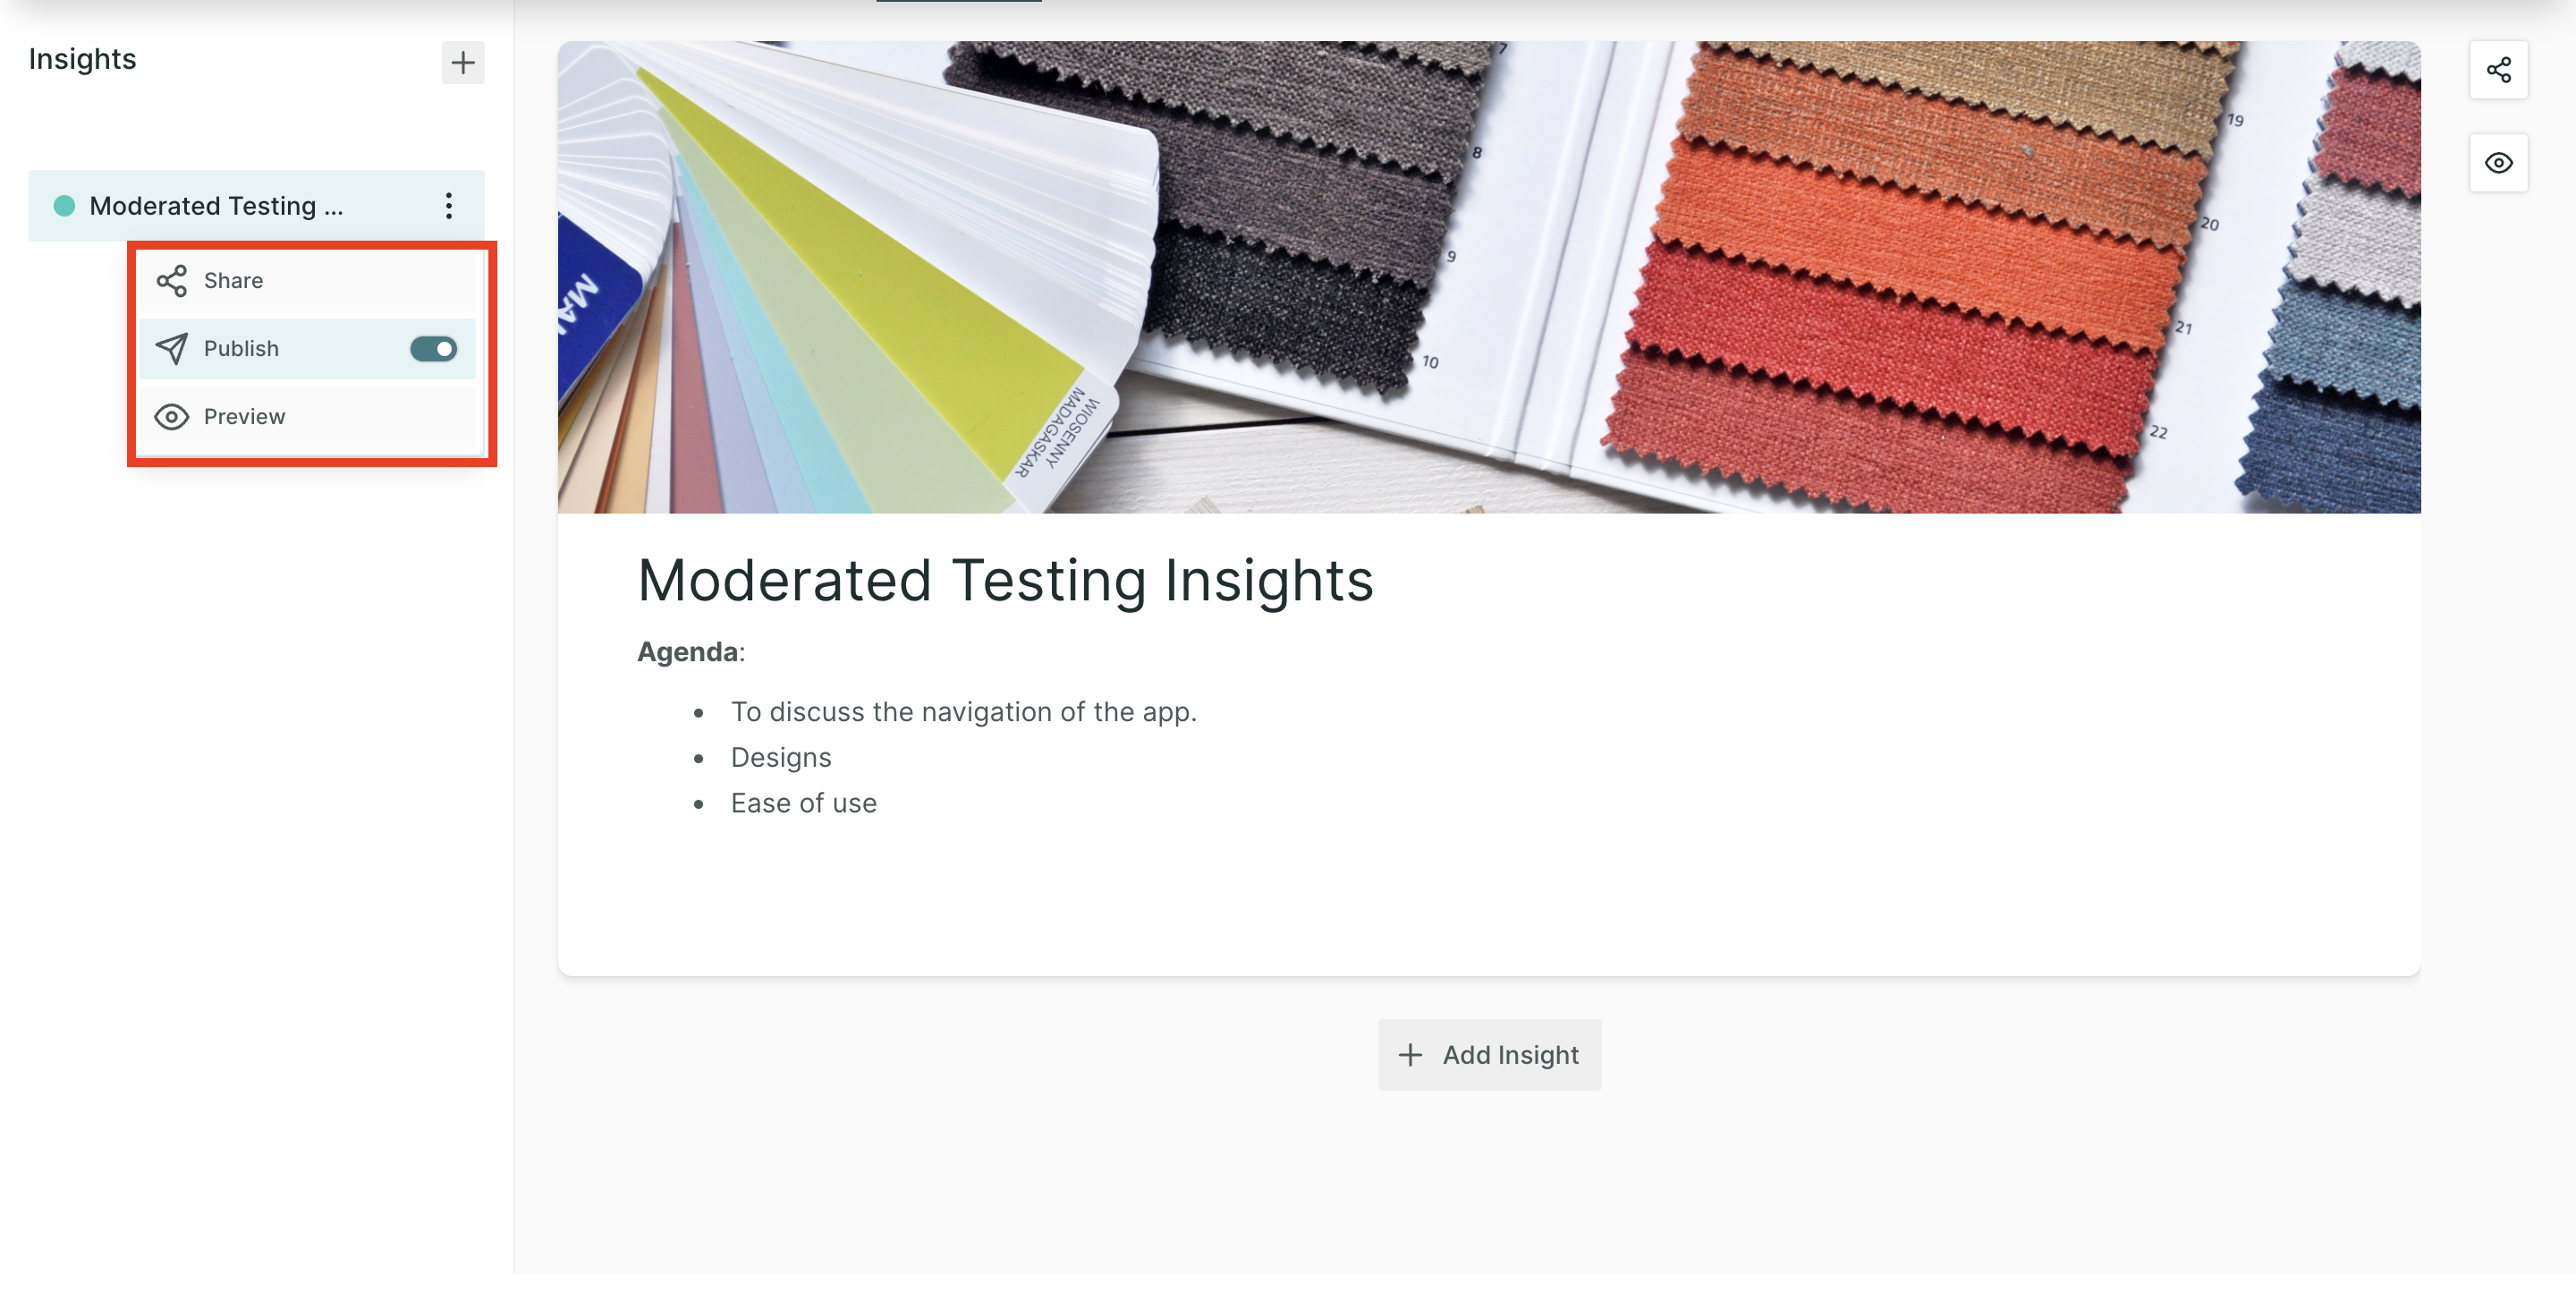
Step 6: you will find a "preview" and "share" button adjacent to the highlight page. You can preview the insights before sharing to make sure everything is looking fine and then share the study with the decode and non-decode users using the share button.
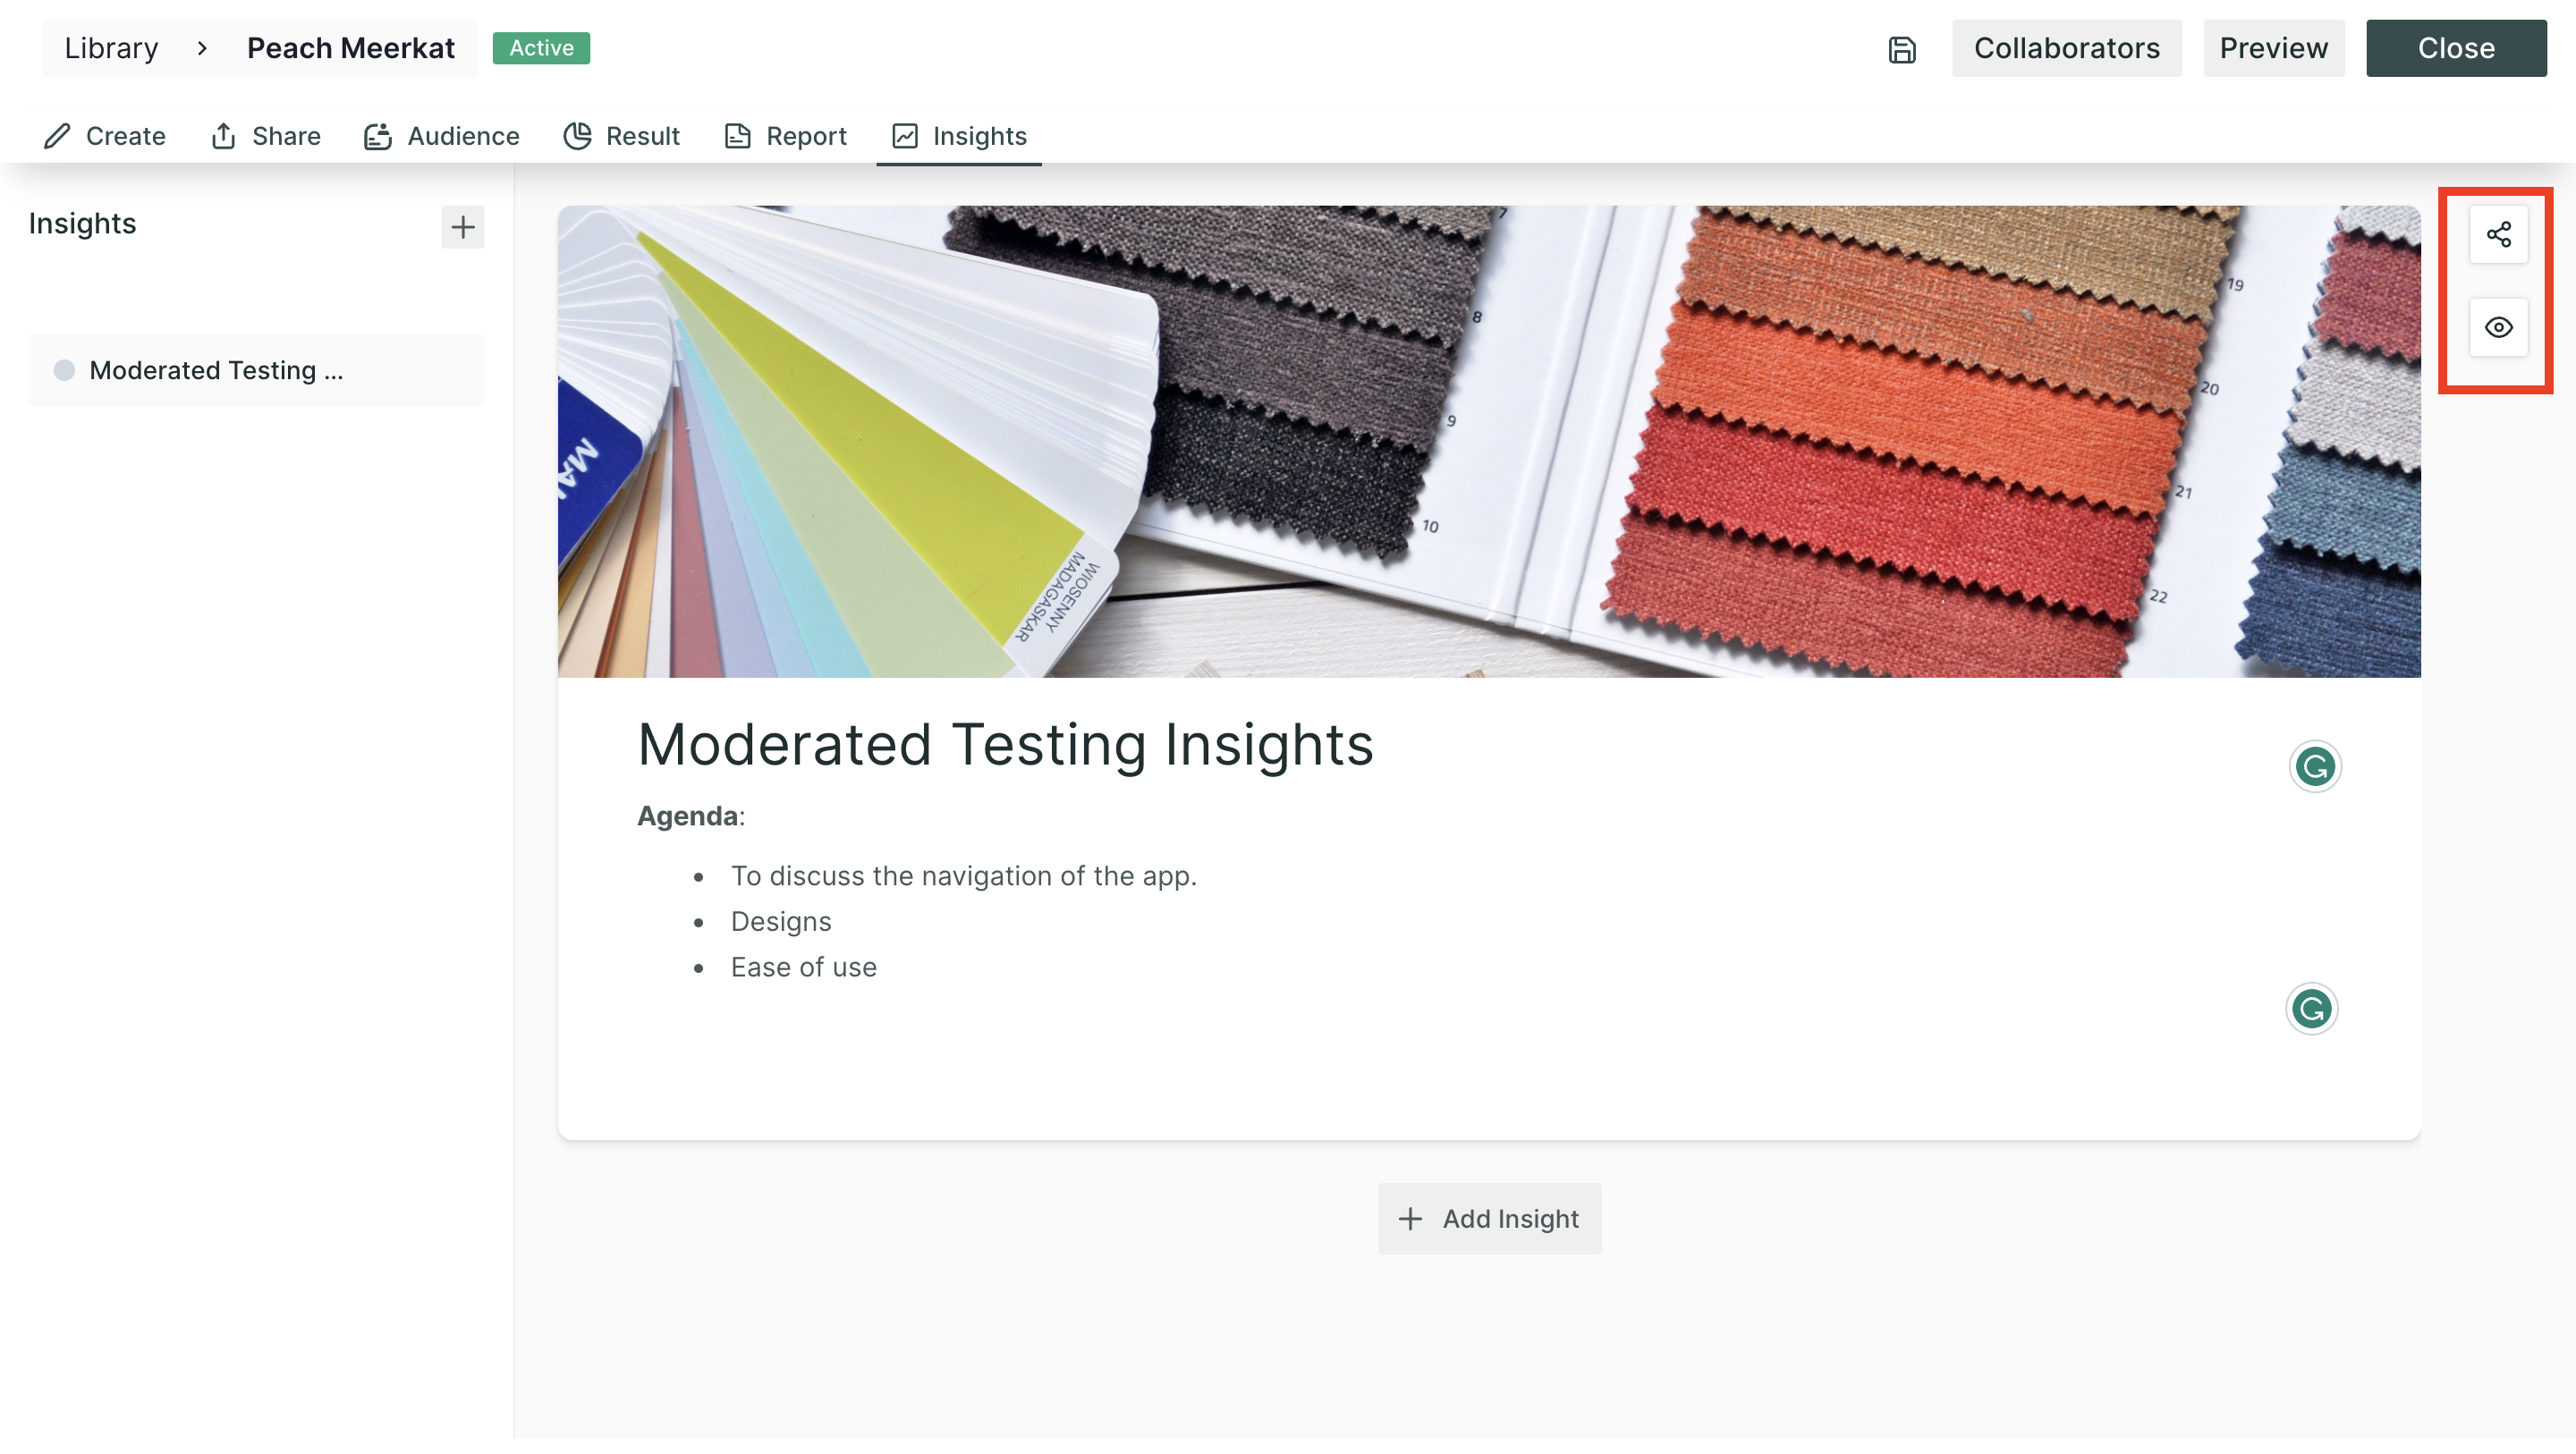
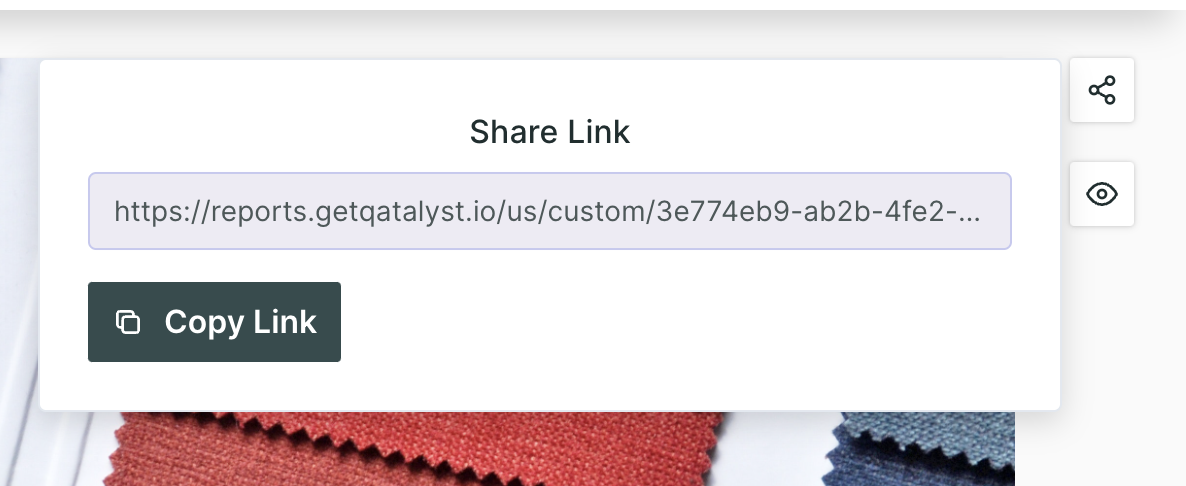
When you click on the share button, you will get a URL for sharing the insight.
Step 7: Before sharing the insights, make sure the insight is published. To publish a particular insight, click on the "Three Dots" and then toggle the publish button.
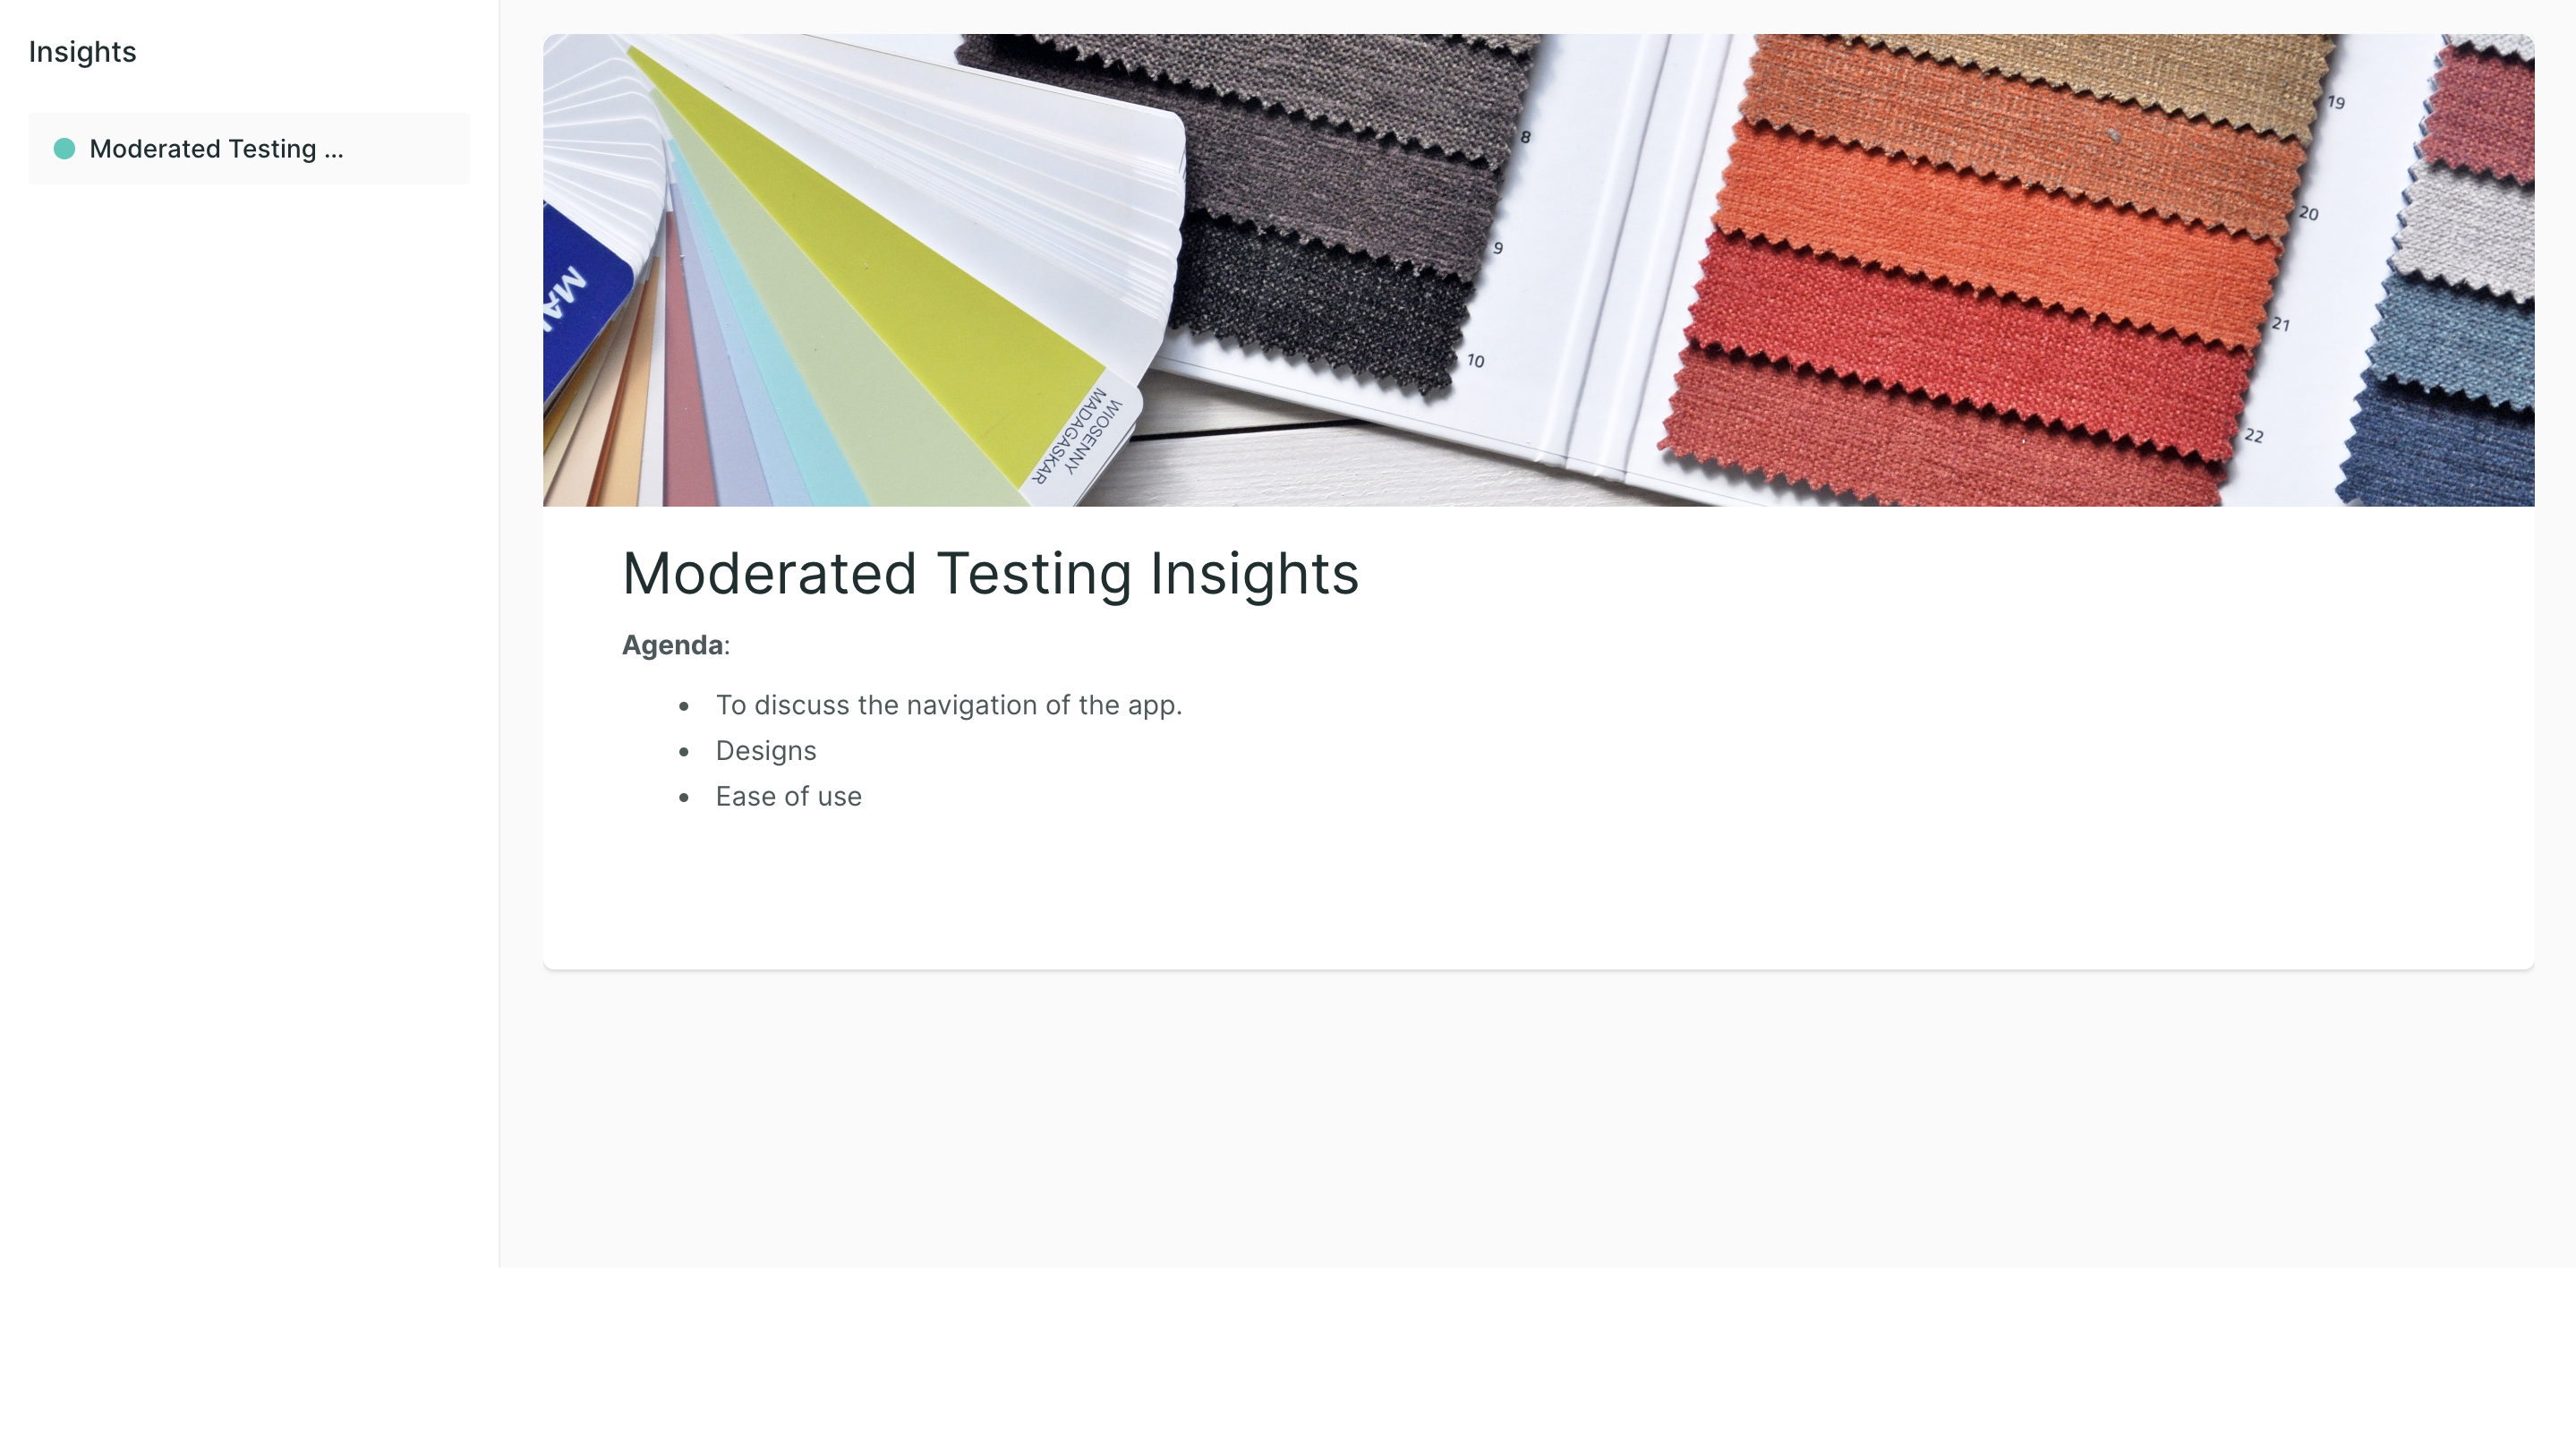
Step 8: Once the insight is published, you can share it with anyone. When the user uses the URL to access the insight page, this is how the page will look like.