
Live Website Testing Analytics
Once the respondents have taken the test, you will be able to see the analytics in the result section. In the result view, you will find the recording of the session along with the transcript and other insights.
Note: When a single task is assigned, the insights provided include a video recording, user path visualizer, journey tree, and performance breakdown. For multiple tasks, the insights will feature only the video recording accompanied by supporting metrics.
Single Task Results
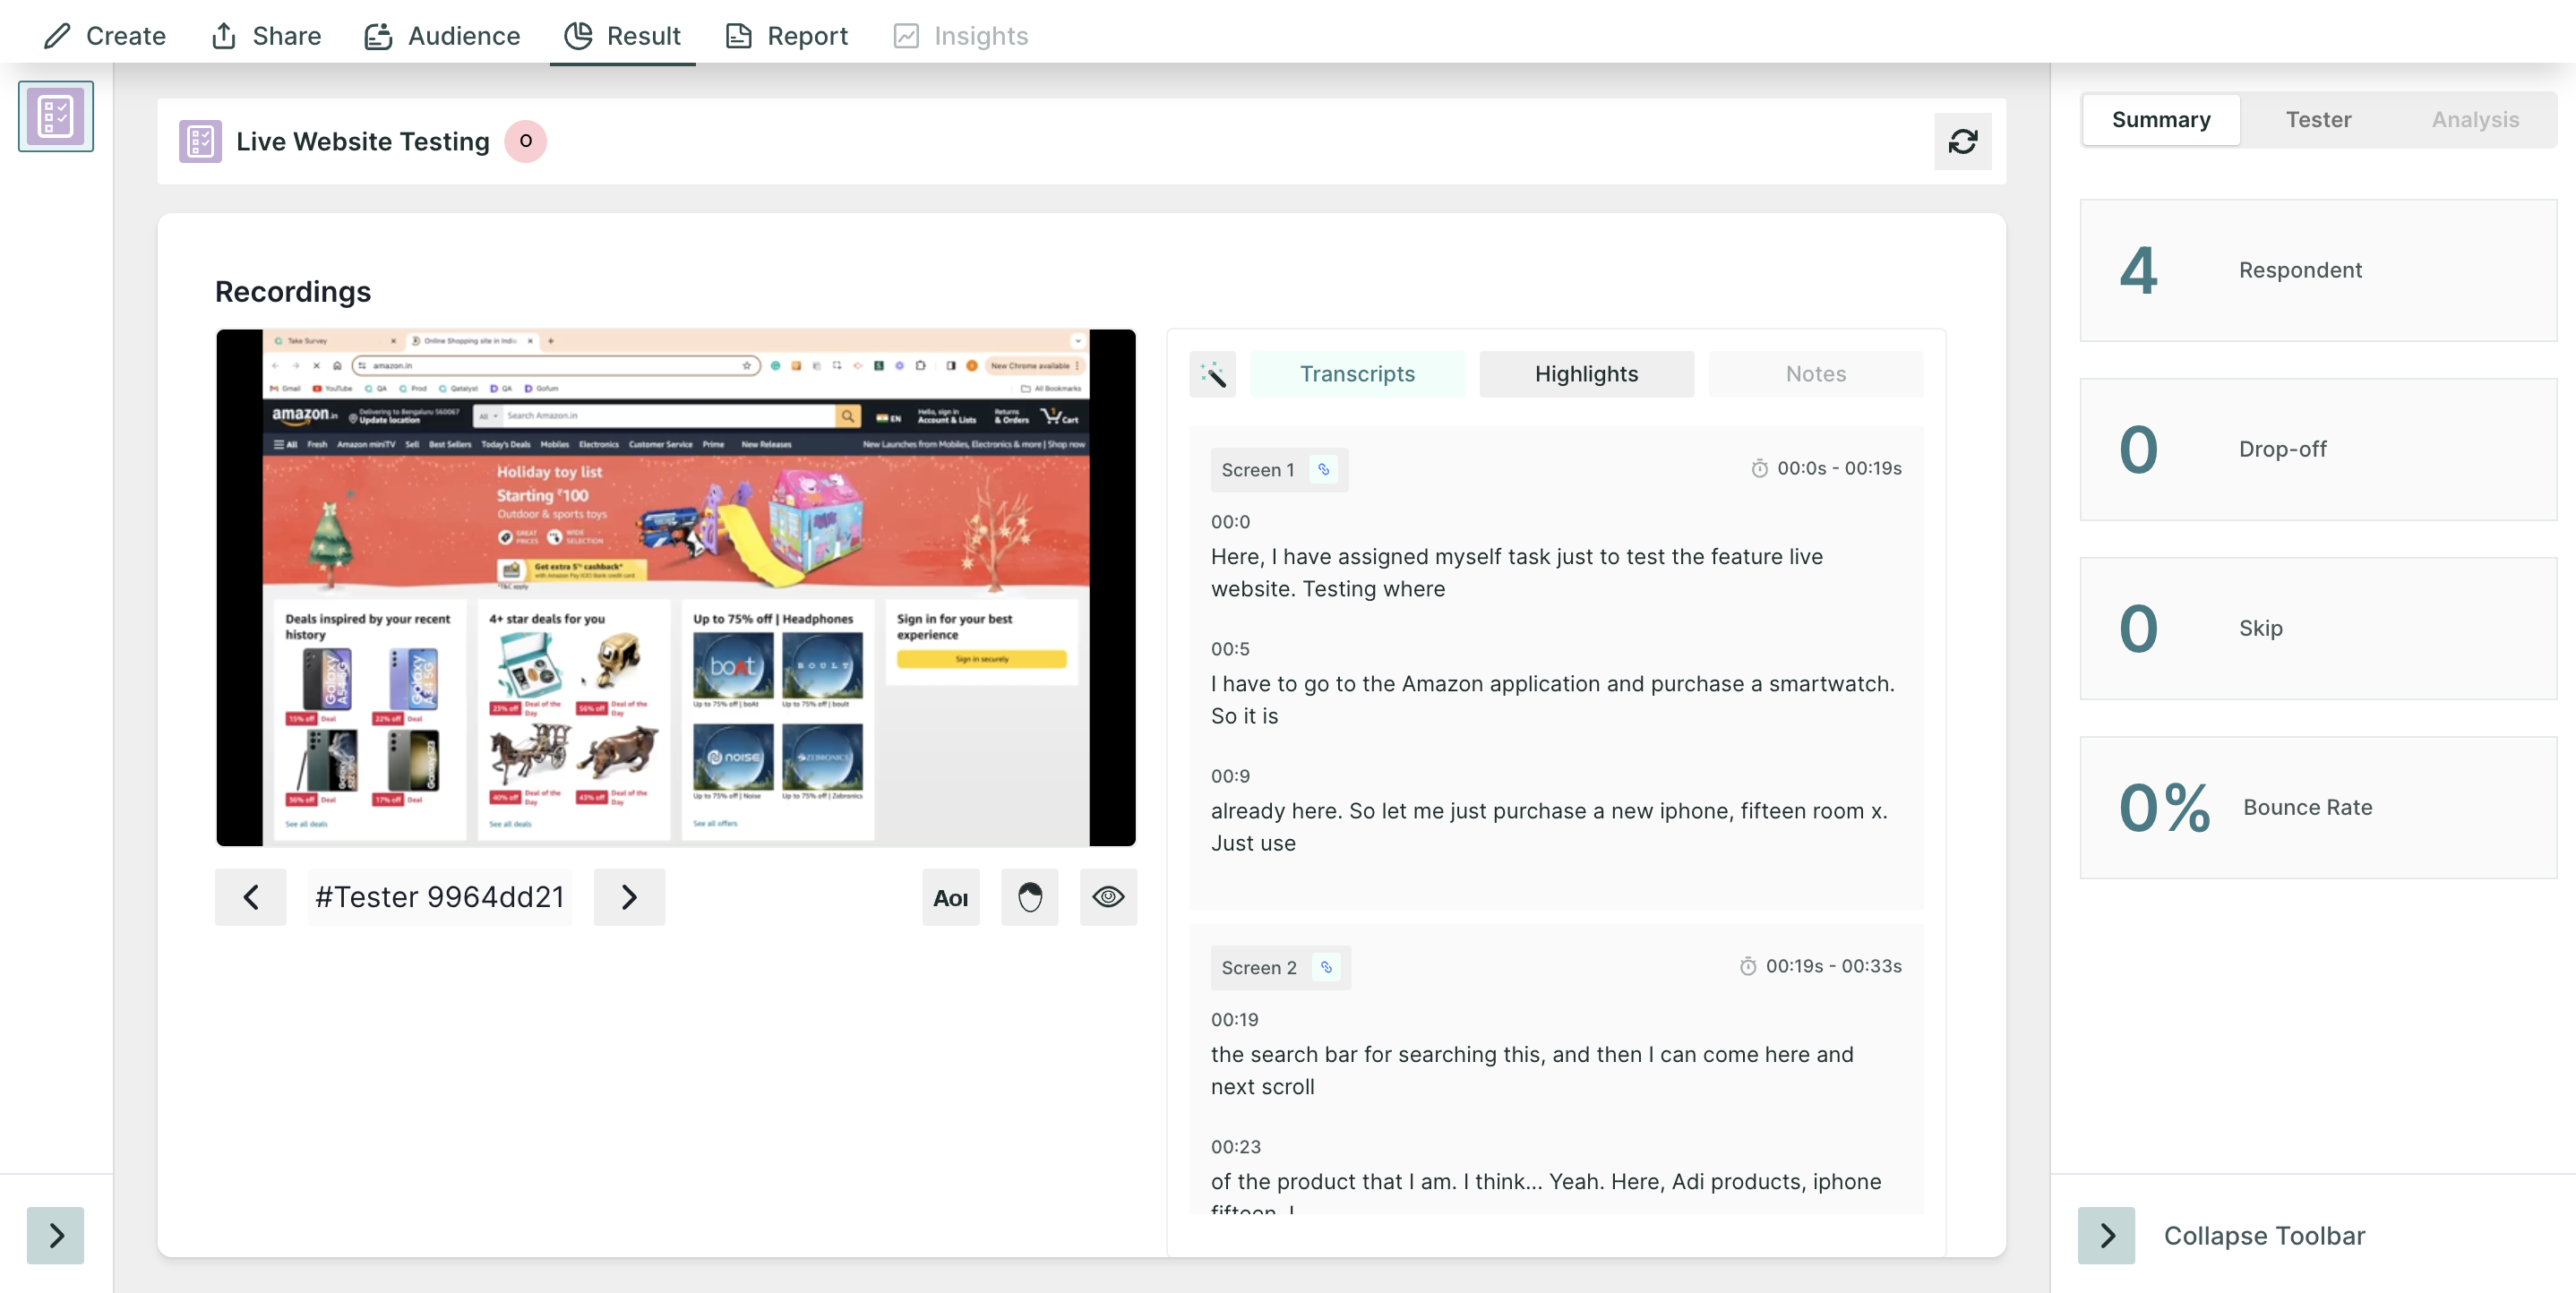
1. Summary Section
In the summary section, you will find the following information:
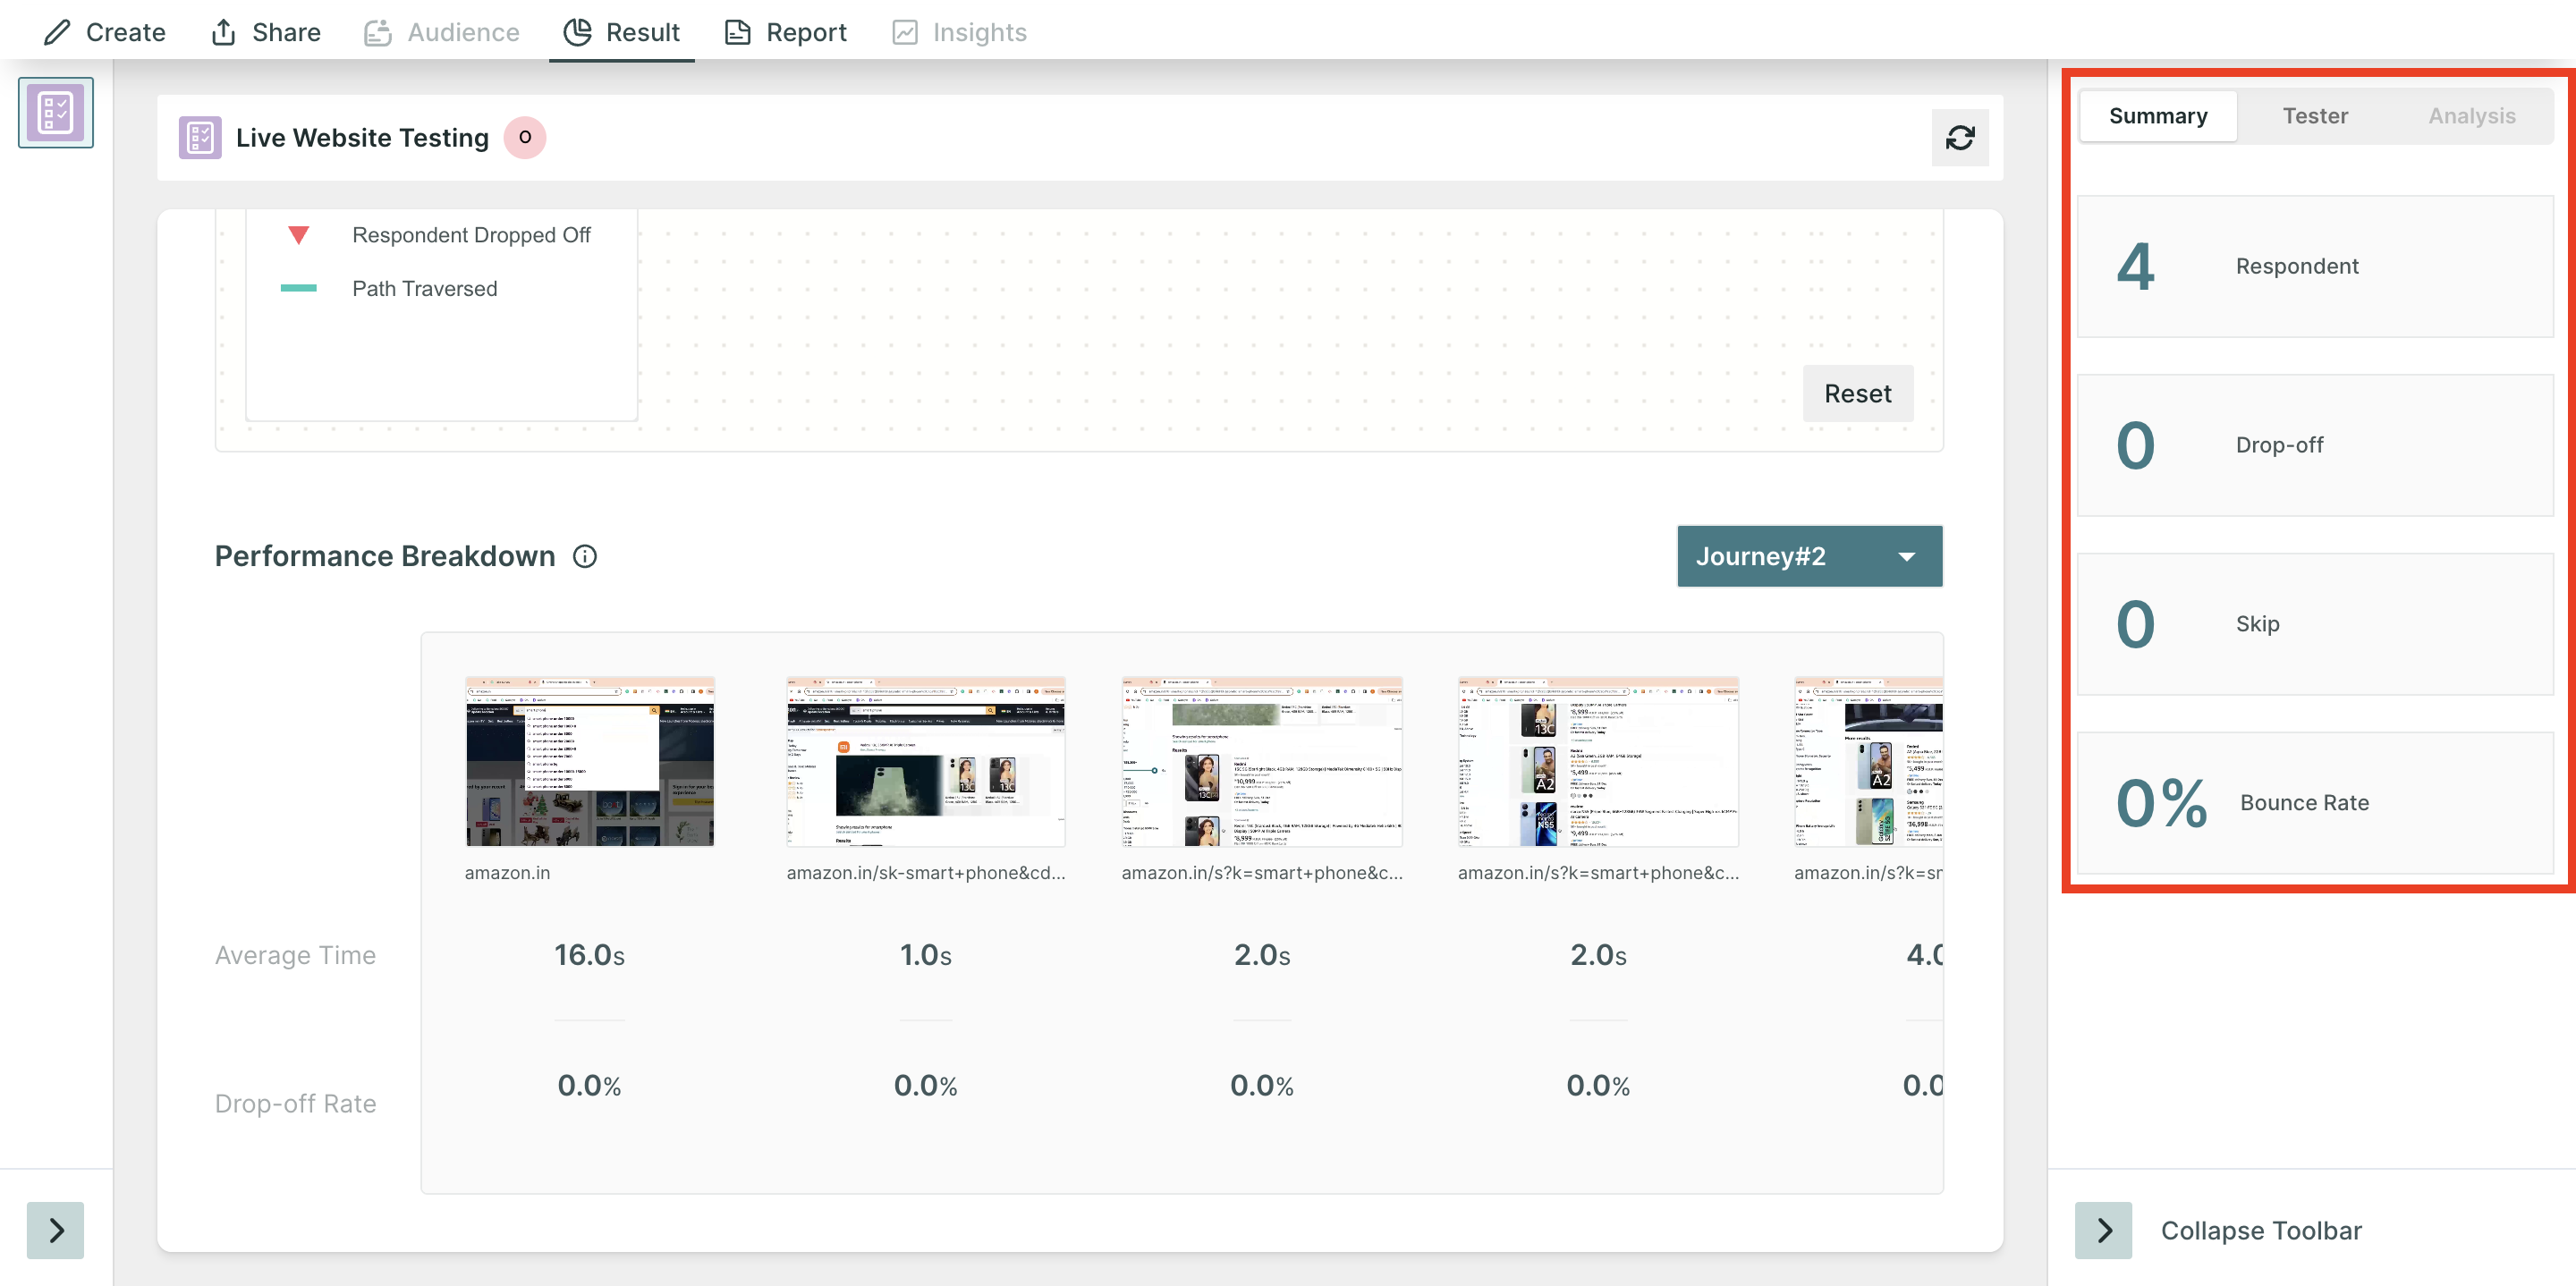
- Respondents: Number of people who initiated the test block.
- Skip The Number of people who choose to skip the block.
- Drop-off: Number of people who have not moved on to the next block.
- Bounce Rate: ((Dropoff + Skip)/ Number of Responses)*100 . (In Percentage)
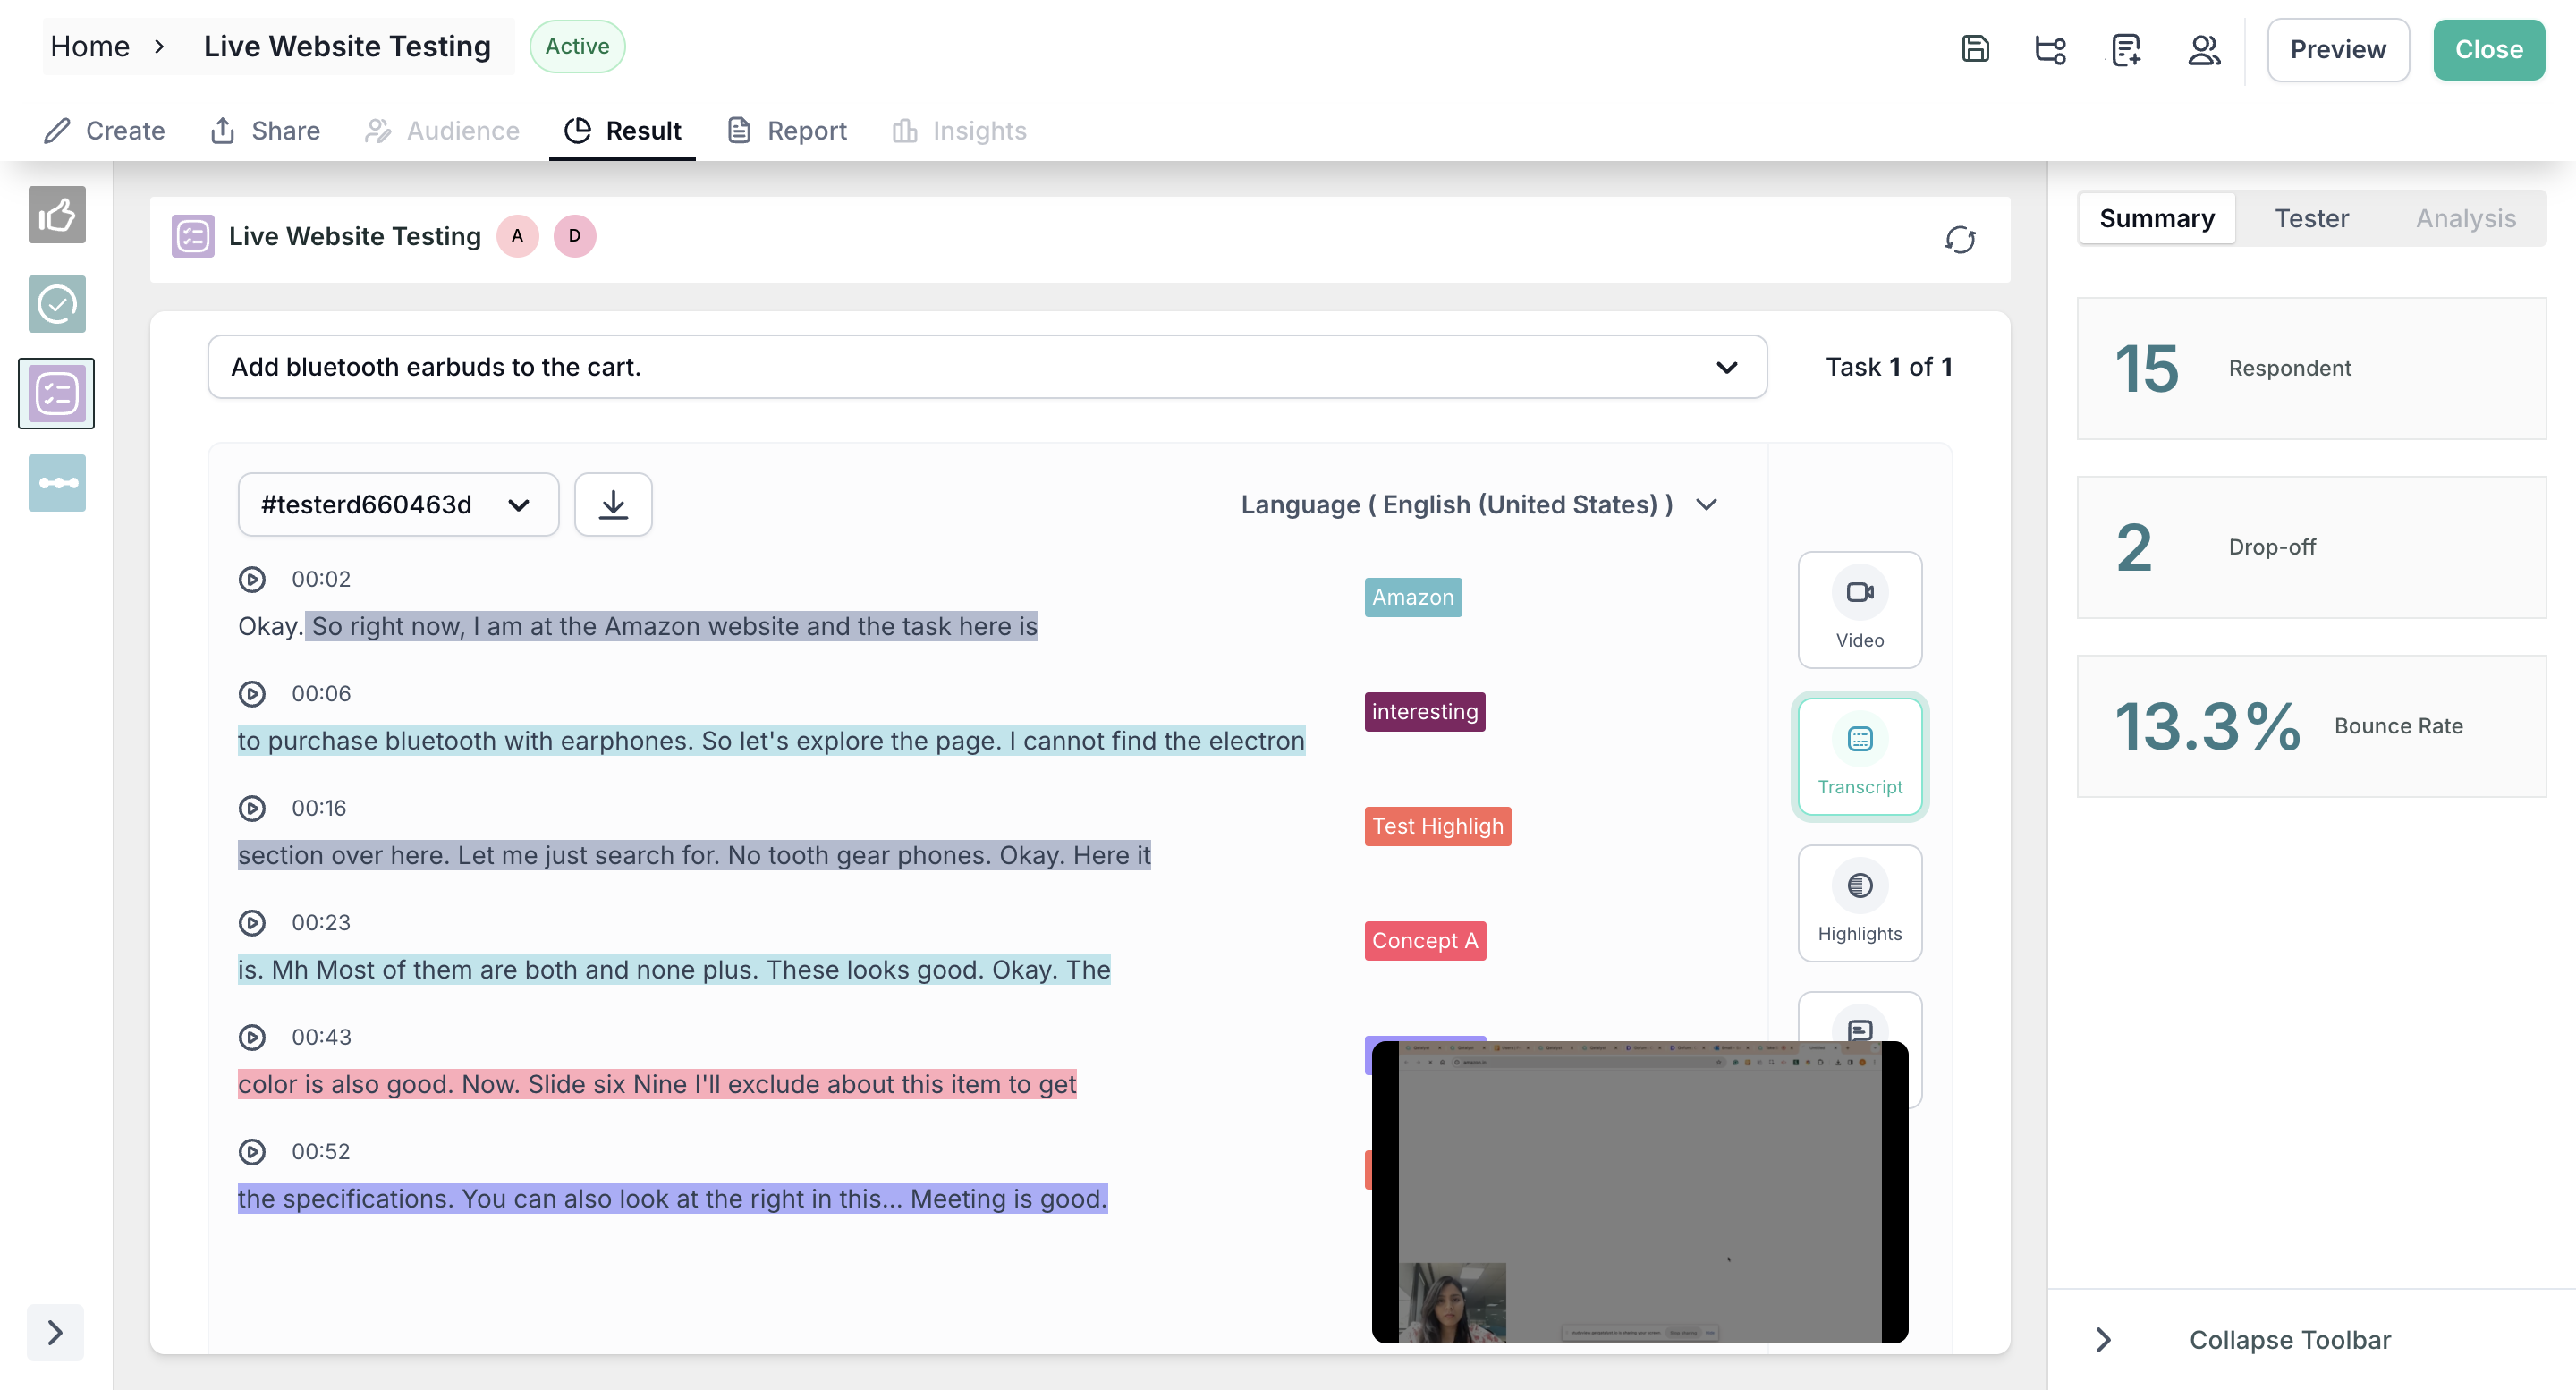
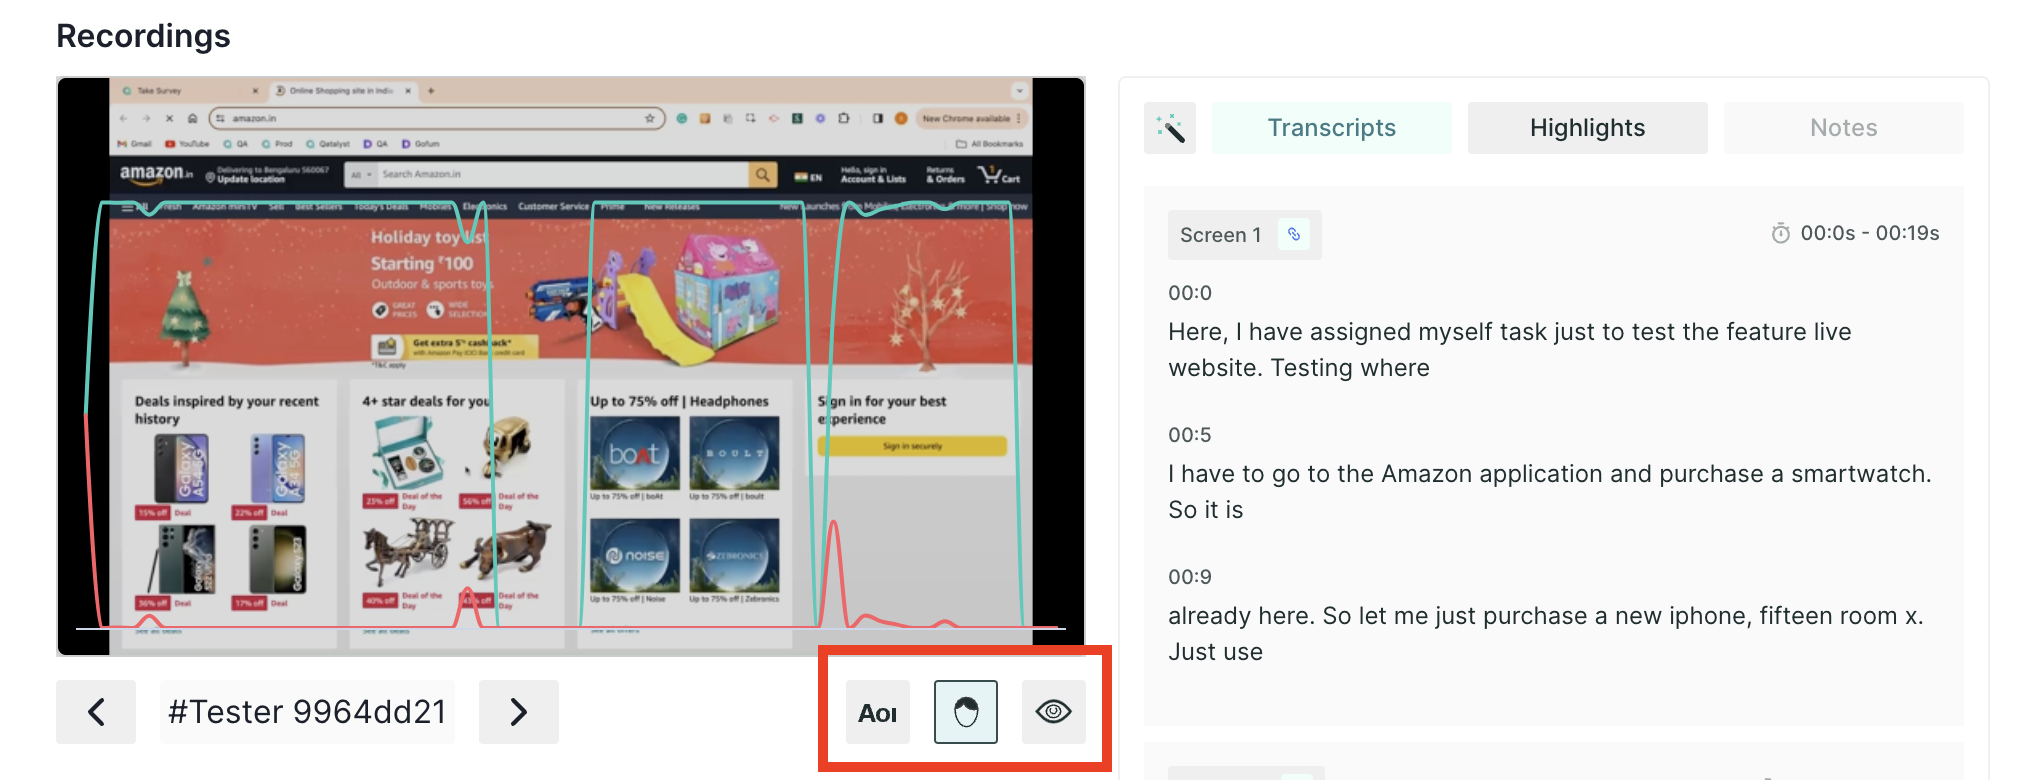
2. Recording and Transcript
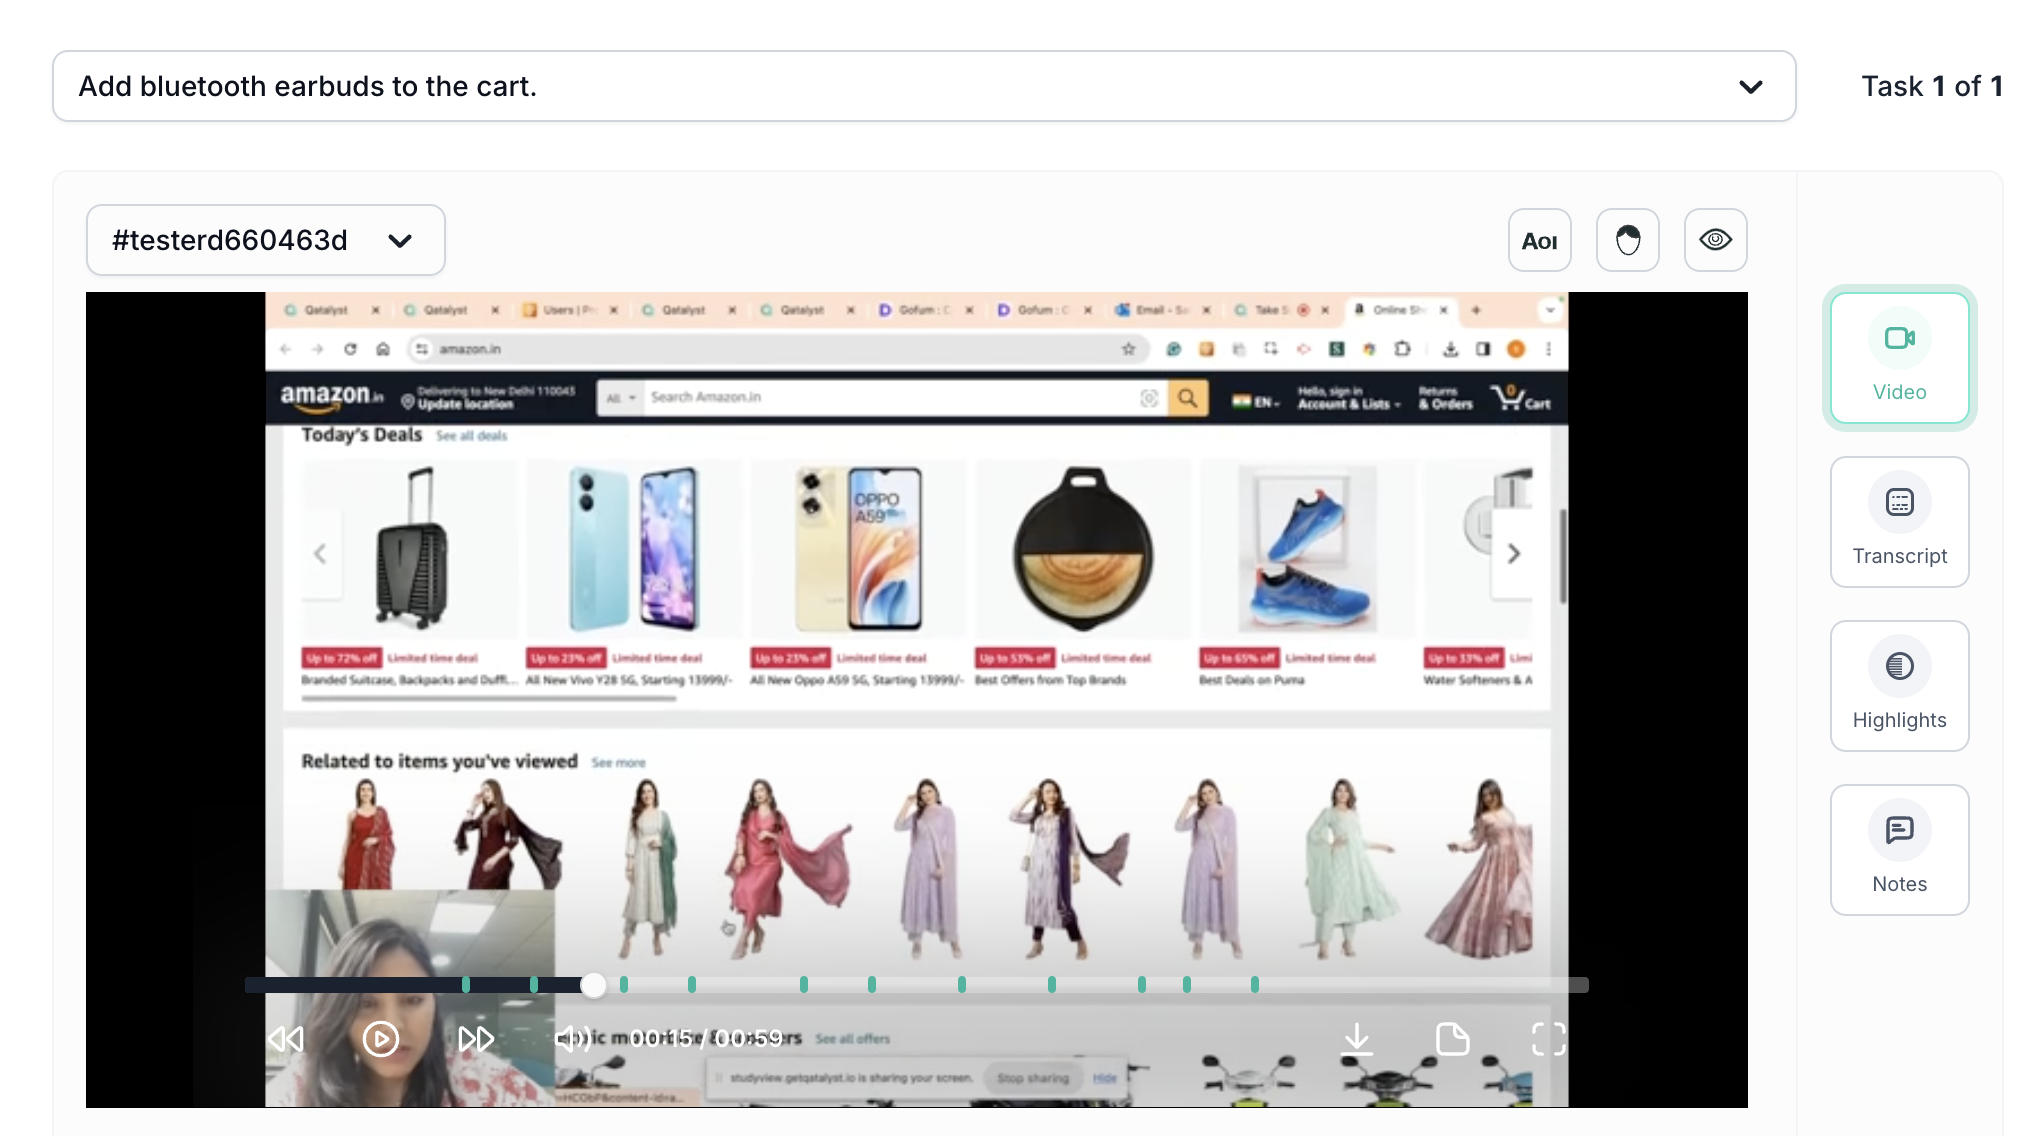
In the result view, you will find the session recording for all the respondents; use the left and right view buttons to view the recordings of different respondents.
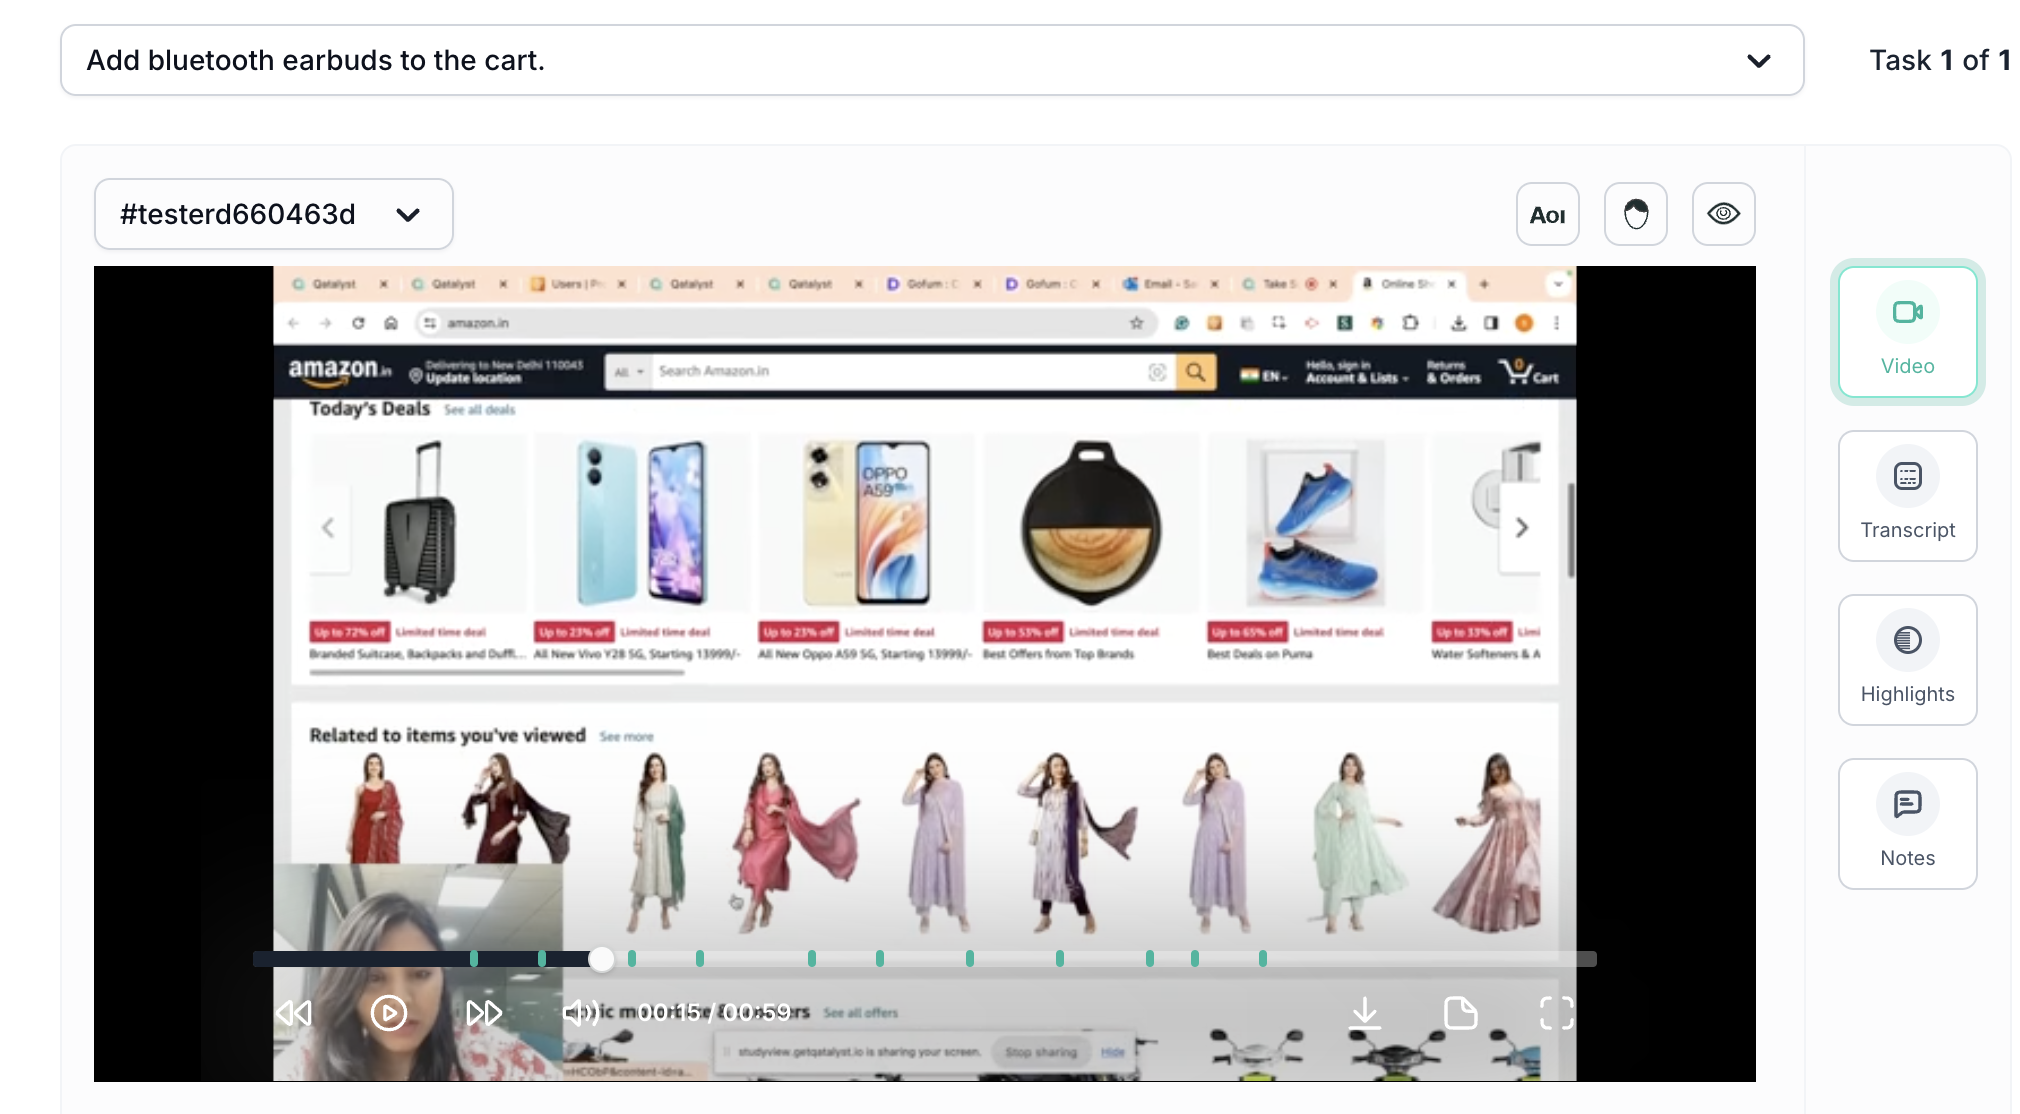
Along with the recording, if the recording has audio, you will find the auto-generated transcript for each screen, where you can create tags and highlight the important parts.
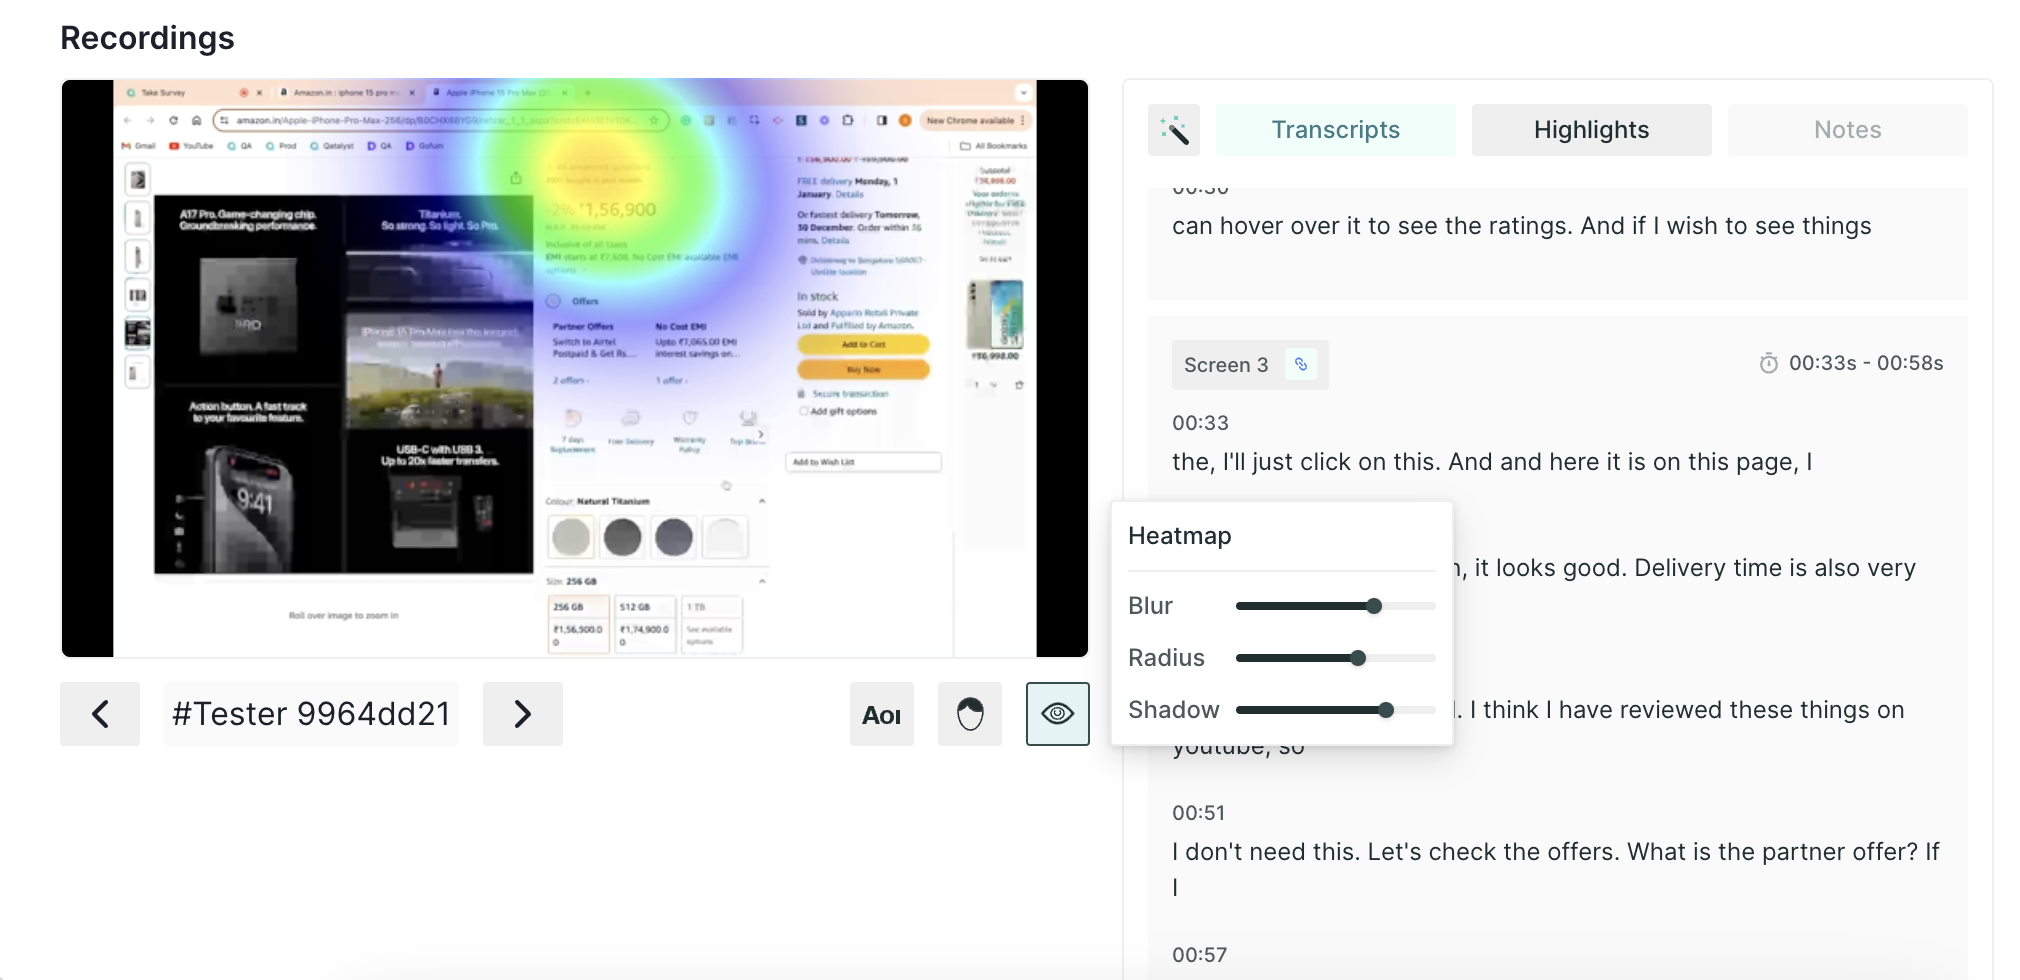
If you have enabled eye tracking and facial coding in the task, you will get insights for both, and they can be viewed by clicking the icons respectively.
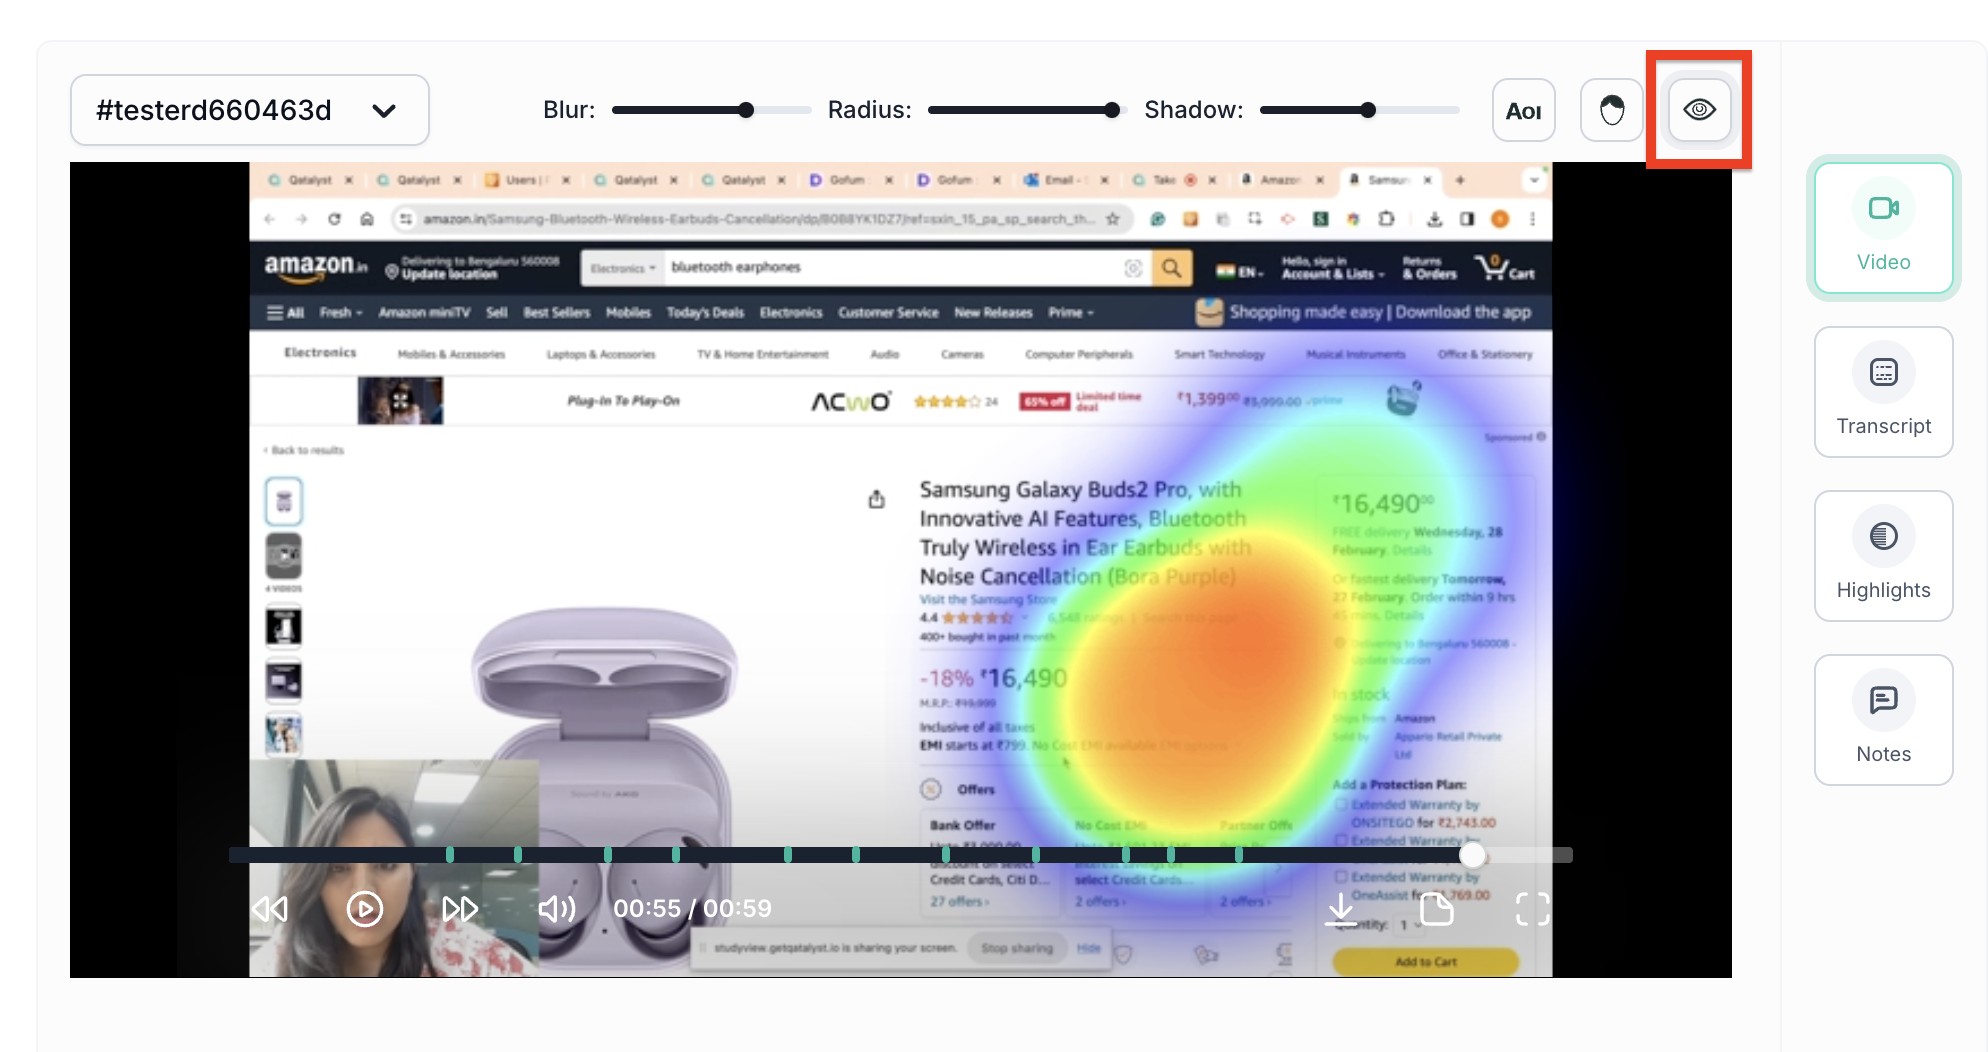
- ET Heatmap: An eye-tracking heatmap is a visual representation of where people look on a page. It is created by tracking the eye movements of users as they interact with the prototype. The heatmap then shows the areas of the screen that received the most attention, with the hottest areas being those that were looked at the most.
You can adjust the parameters like blur, radius, and shadow as per your preference.
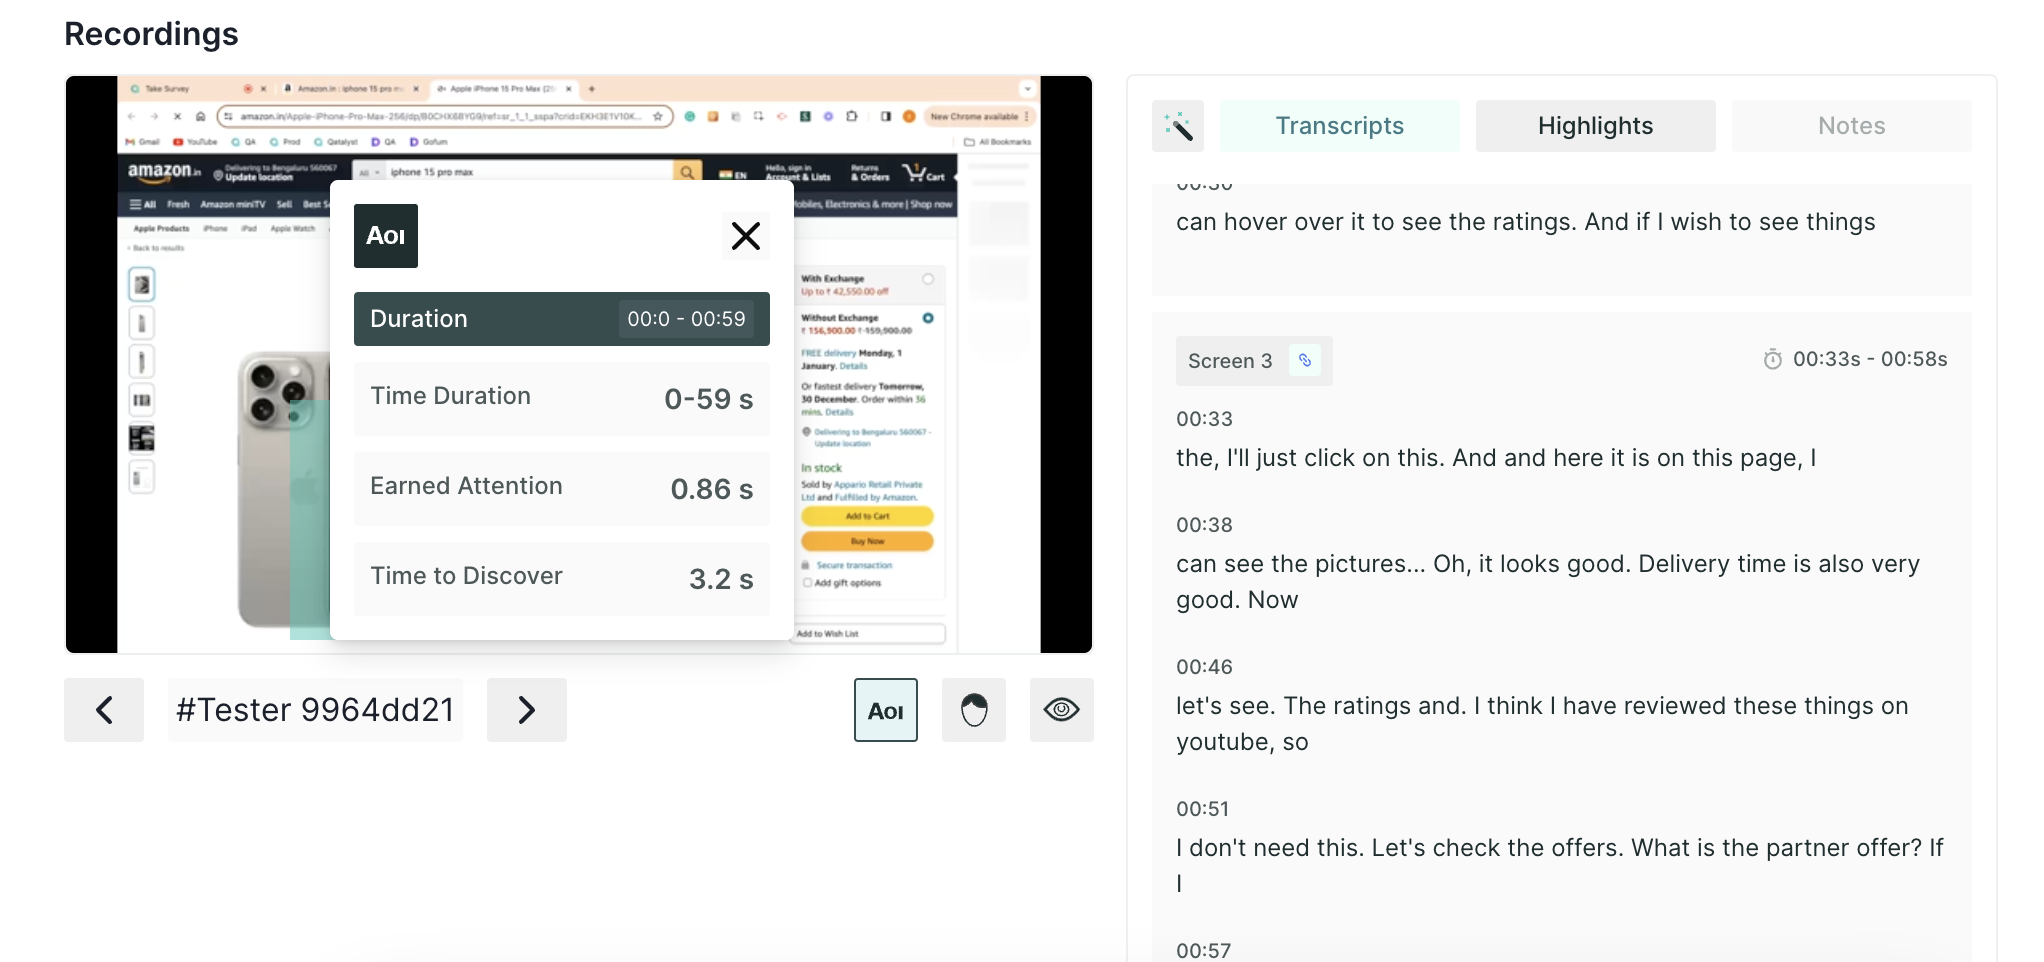
- Area of Interest(AOI): AOI is an extension to the eye tracking metrics. It allows you to analyse the performance of particular elements on the screen. Once you select the AOI option, just draw a box over the element, and then a pop-up will appear on the screen for time selection, you can select the time frame and insights will appear in a few seconds.
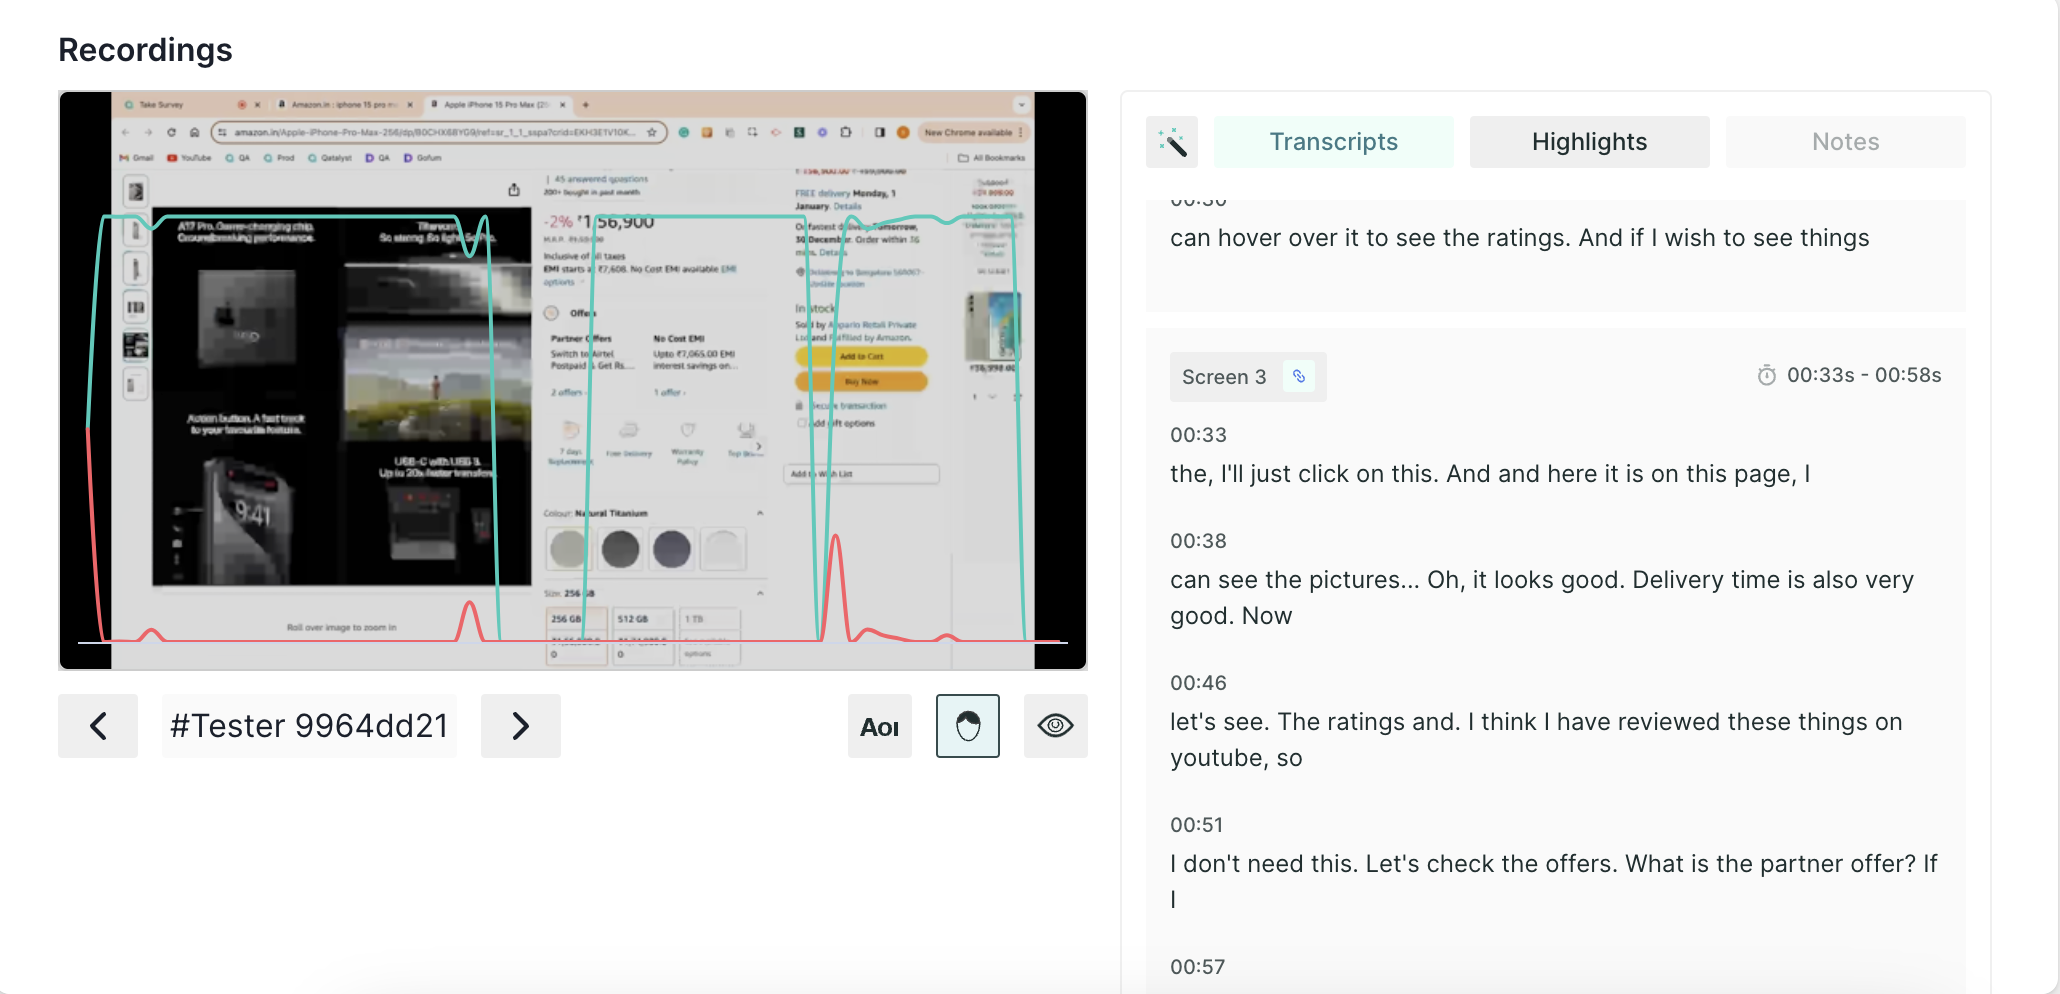
- Emotion AI Metrics: Dive into the emotional resonance of your content with metrics that categorize user responses as positive and negative, allowing you to gauge the emotional impact of your website.
3. User Path Visualizer
User Path Visualizer provides an insightful representation of user journeys via the Sankey chart. This visualizer presents the paths taken by users through the website, offering a comprehensive view of the navigation patterns.
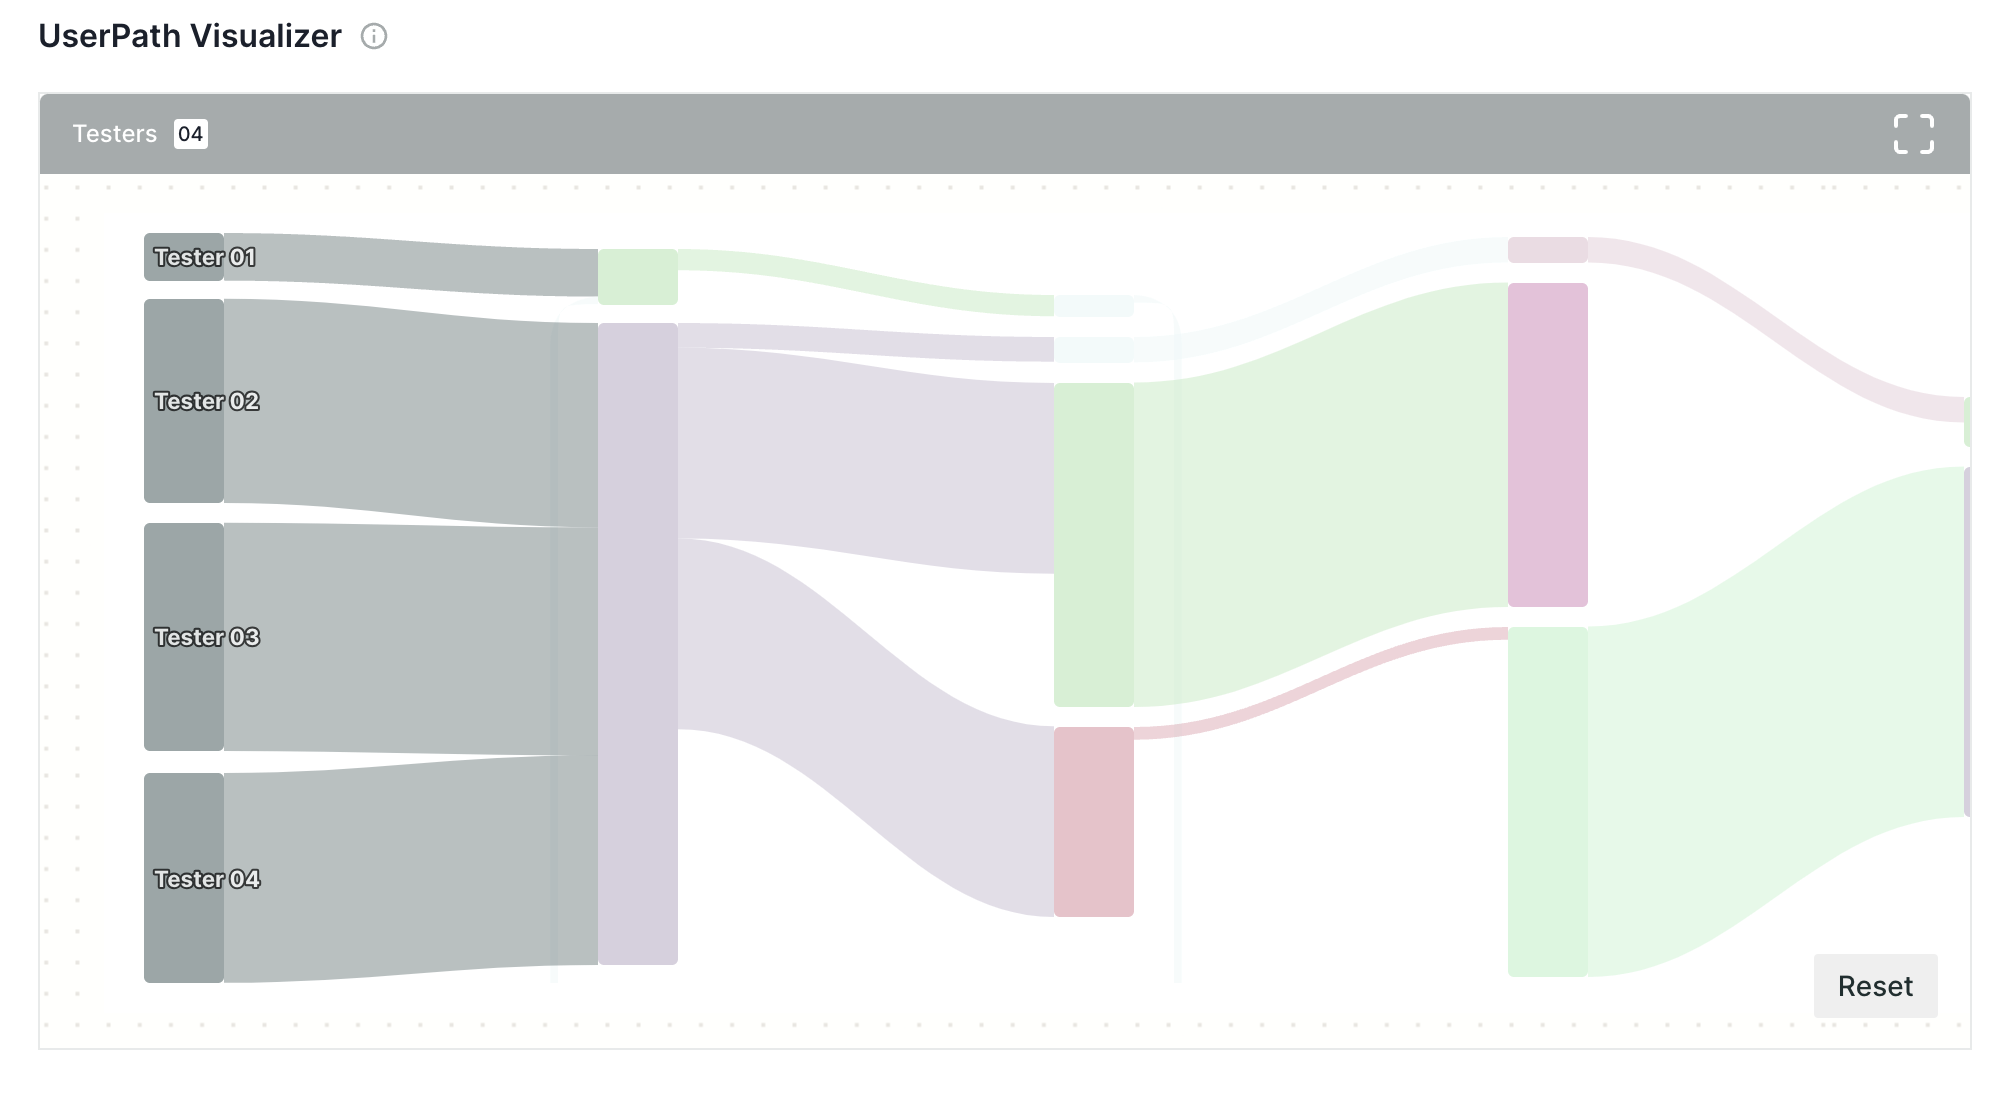
Additionally, it encapsulates various essential details such as the time users spent on each page, the number of users who visited specific pages, and the transitions between these pages.
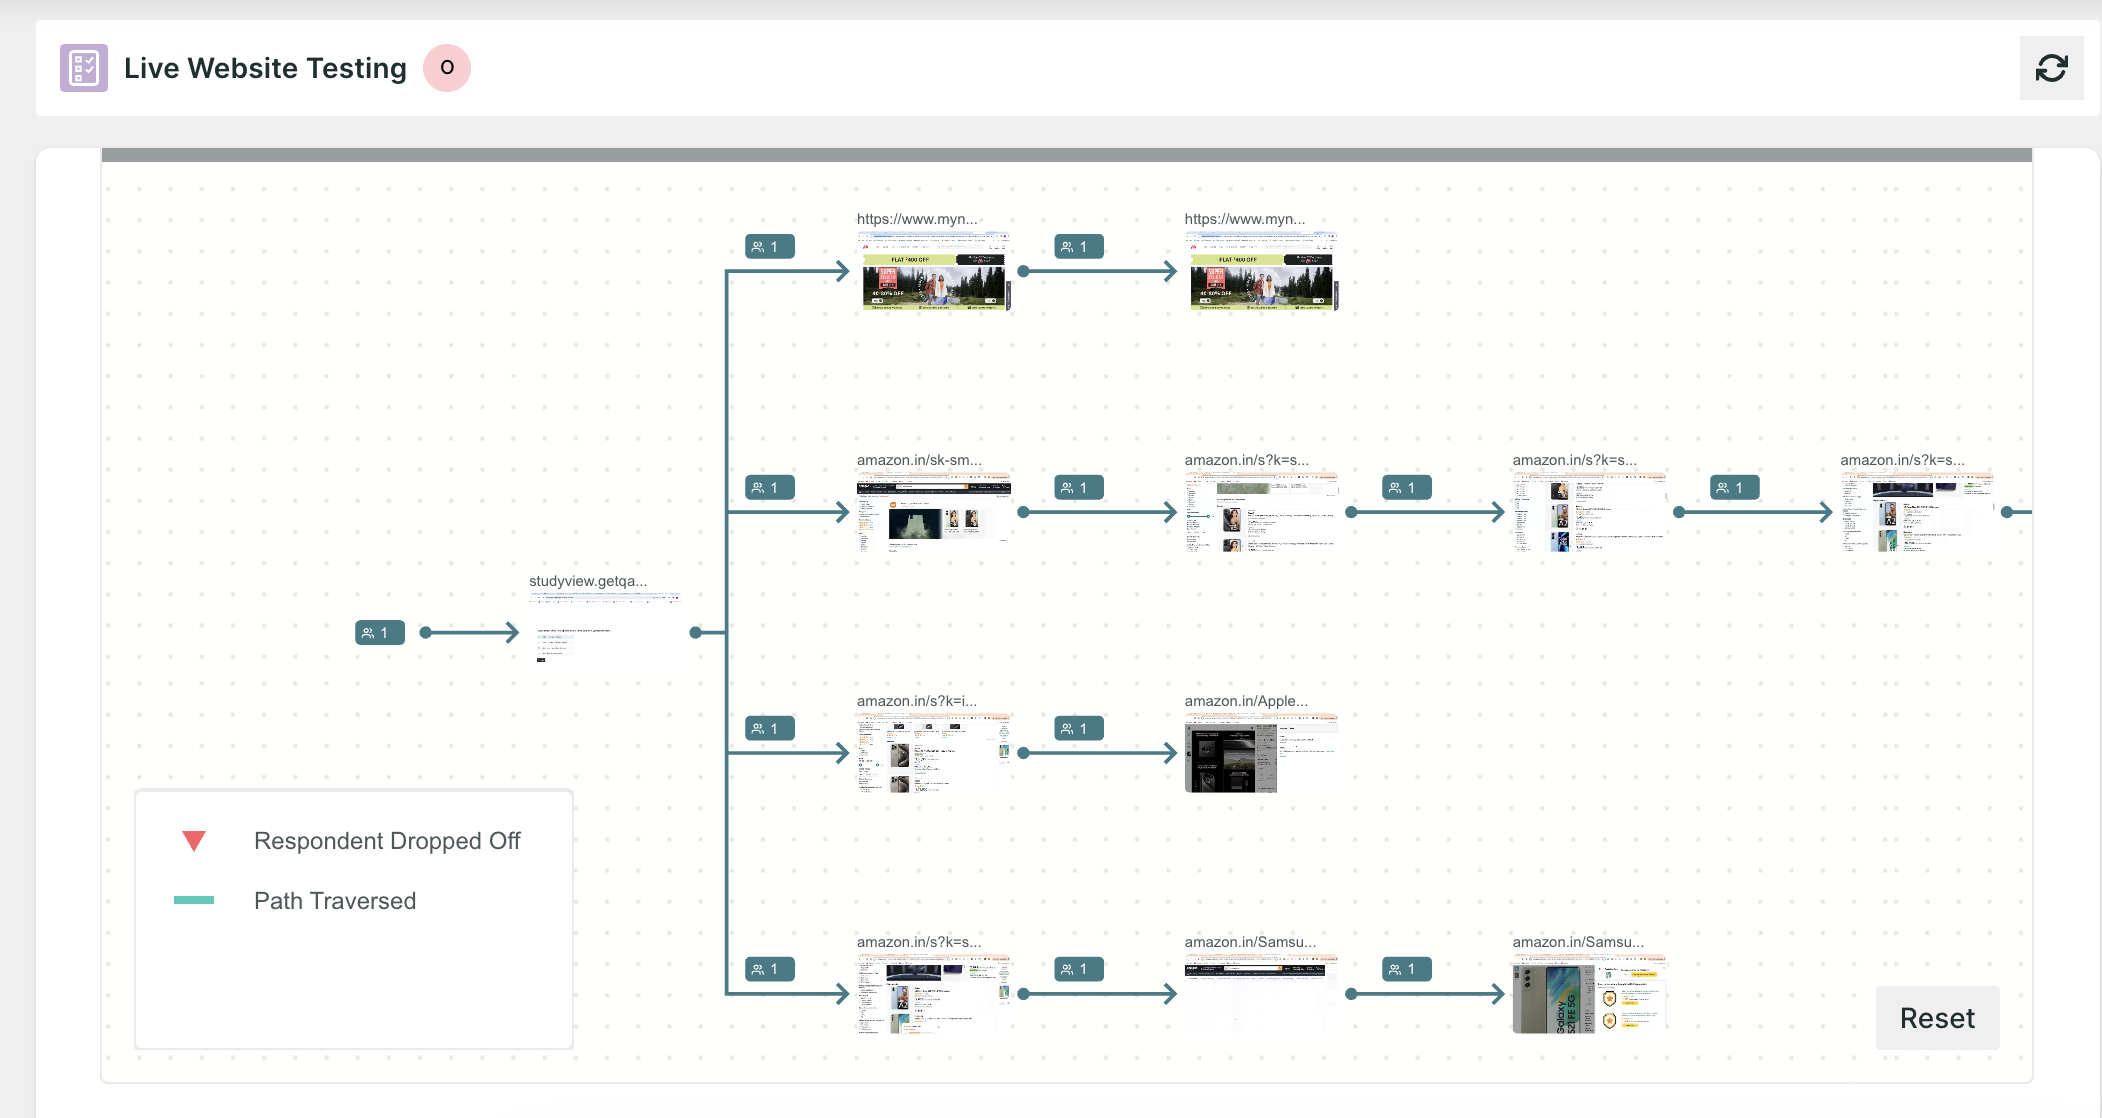
4. Journey Tree
Journey Tree provides a hierarchical representation of user journeys, presenting a structured view of the paths users take as they navigate through the website along with the dropped user count a page level.
5. Performance Breakdown
Average Time: This metric offers a glimpse into user engagement by tracking the average duration visitors spend on each page of the website. It serves as an indicator of user interest, interaction, and satisfaction with the provided content and usability.
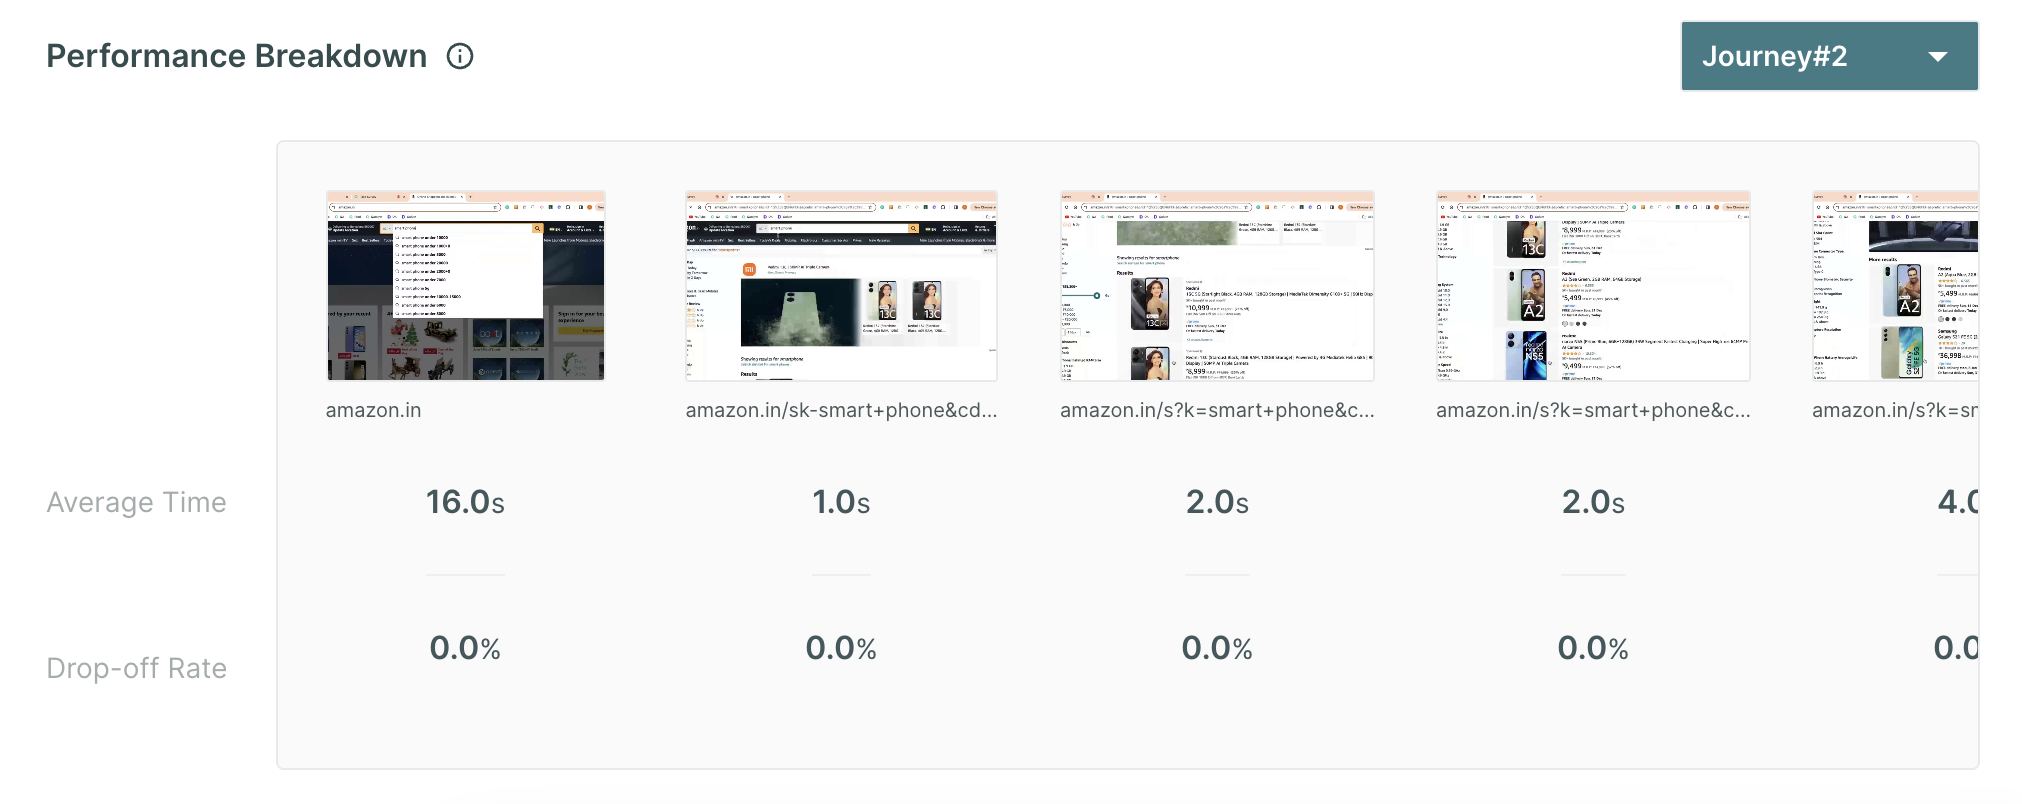
Dropoff Rate: The drop-off rate provides a page-by-page analysis of the percentage of users who leave or abandon the website. These points highlight areas where users disengage or encounter difficulties. Analyzing drop-off points helps pinpoint potential issues such as confusing navigation, uninteresting content, or technical problems that prompt users to leave prematurely.
Multiple Task Results
1. Summary Section
In the summary section, you will find the following information:
- Respondents: Number of people who initiated the test block.
- Skip The Number of people who choose to skip the block.
- Drop-off: Number of people who have not moved on to the next block.
- Bounce Rate: ((Dropoff + Skip)/ Number of Responses)*100 . (In Percentage)
2. Recording and Transcript
In the result view, you will find the session recording for all the respondents; use the left and right view buttons to view the recordings of different respondents.
Along with the recording, if the recording has audio, you will find the auto-generated transcript for each screen, where you can create tags and highlight the important parts.
If you have enabled eye tracking and facial coding in the task, you will get insights for both, and they can be viewed by clicking the icons respectively.
- ET Heatmap: An eye-tracking heatmap is a visual representation of where people look on a page. It is created by tracking the eye movements of users as they interact with the prototype. The heatmap then shows the areas of the screen that received the most attention, with the hottest areas being those that were looked at the most.
You can adjust the parameters like blur, radius, and shadow as per your preference.
- Area of Interest(AOI): AOI is an extension to the eye tracking metrics. It allows you to analyse the performance of particular elements on the screen. Once you select the AOI option, just draw a box over the element, and then a pop-up will appear on the screen for time selection, you can select the time frame and insights will appear in a few seconds.
- Emotion AI Metrics: Dive into the emotional resonance of your content with metrics that categorize user responses as positive and negative, allowing you to gauge the emotional impact of your website.