Card Sort in Qatalyst
Card sorting is a valuable user research technique used to understand how individuals organize information mentally. By leveraging card sorting, analysts can gain valuable insights into how users perceive relationships between concepts and how they expect information to be organized. These insights, in turn, inform the design and structure of websites, applications, and other information systems, leading to enhanced usability and an improved user experience.
Create a Card Sort in Qatalyst👩🏻💻
To create a card sort, follow these simple steps:
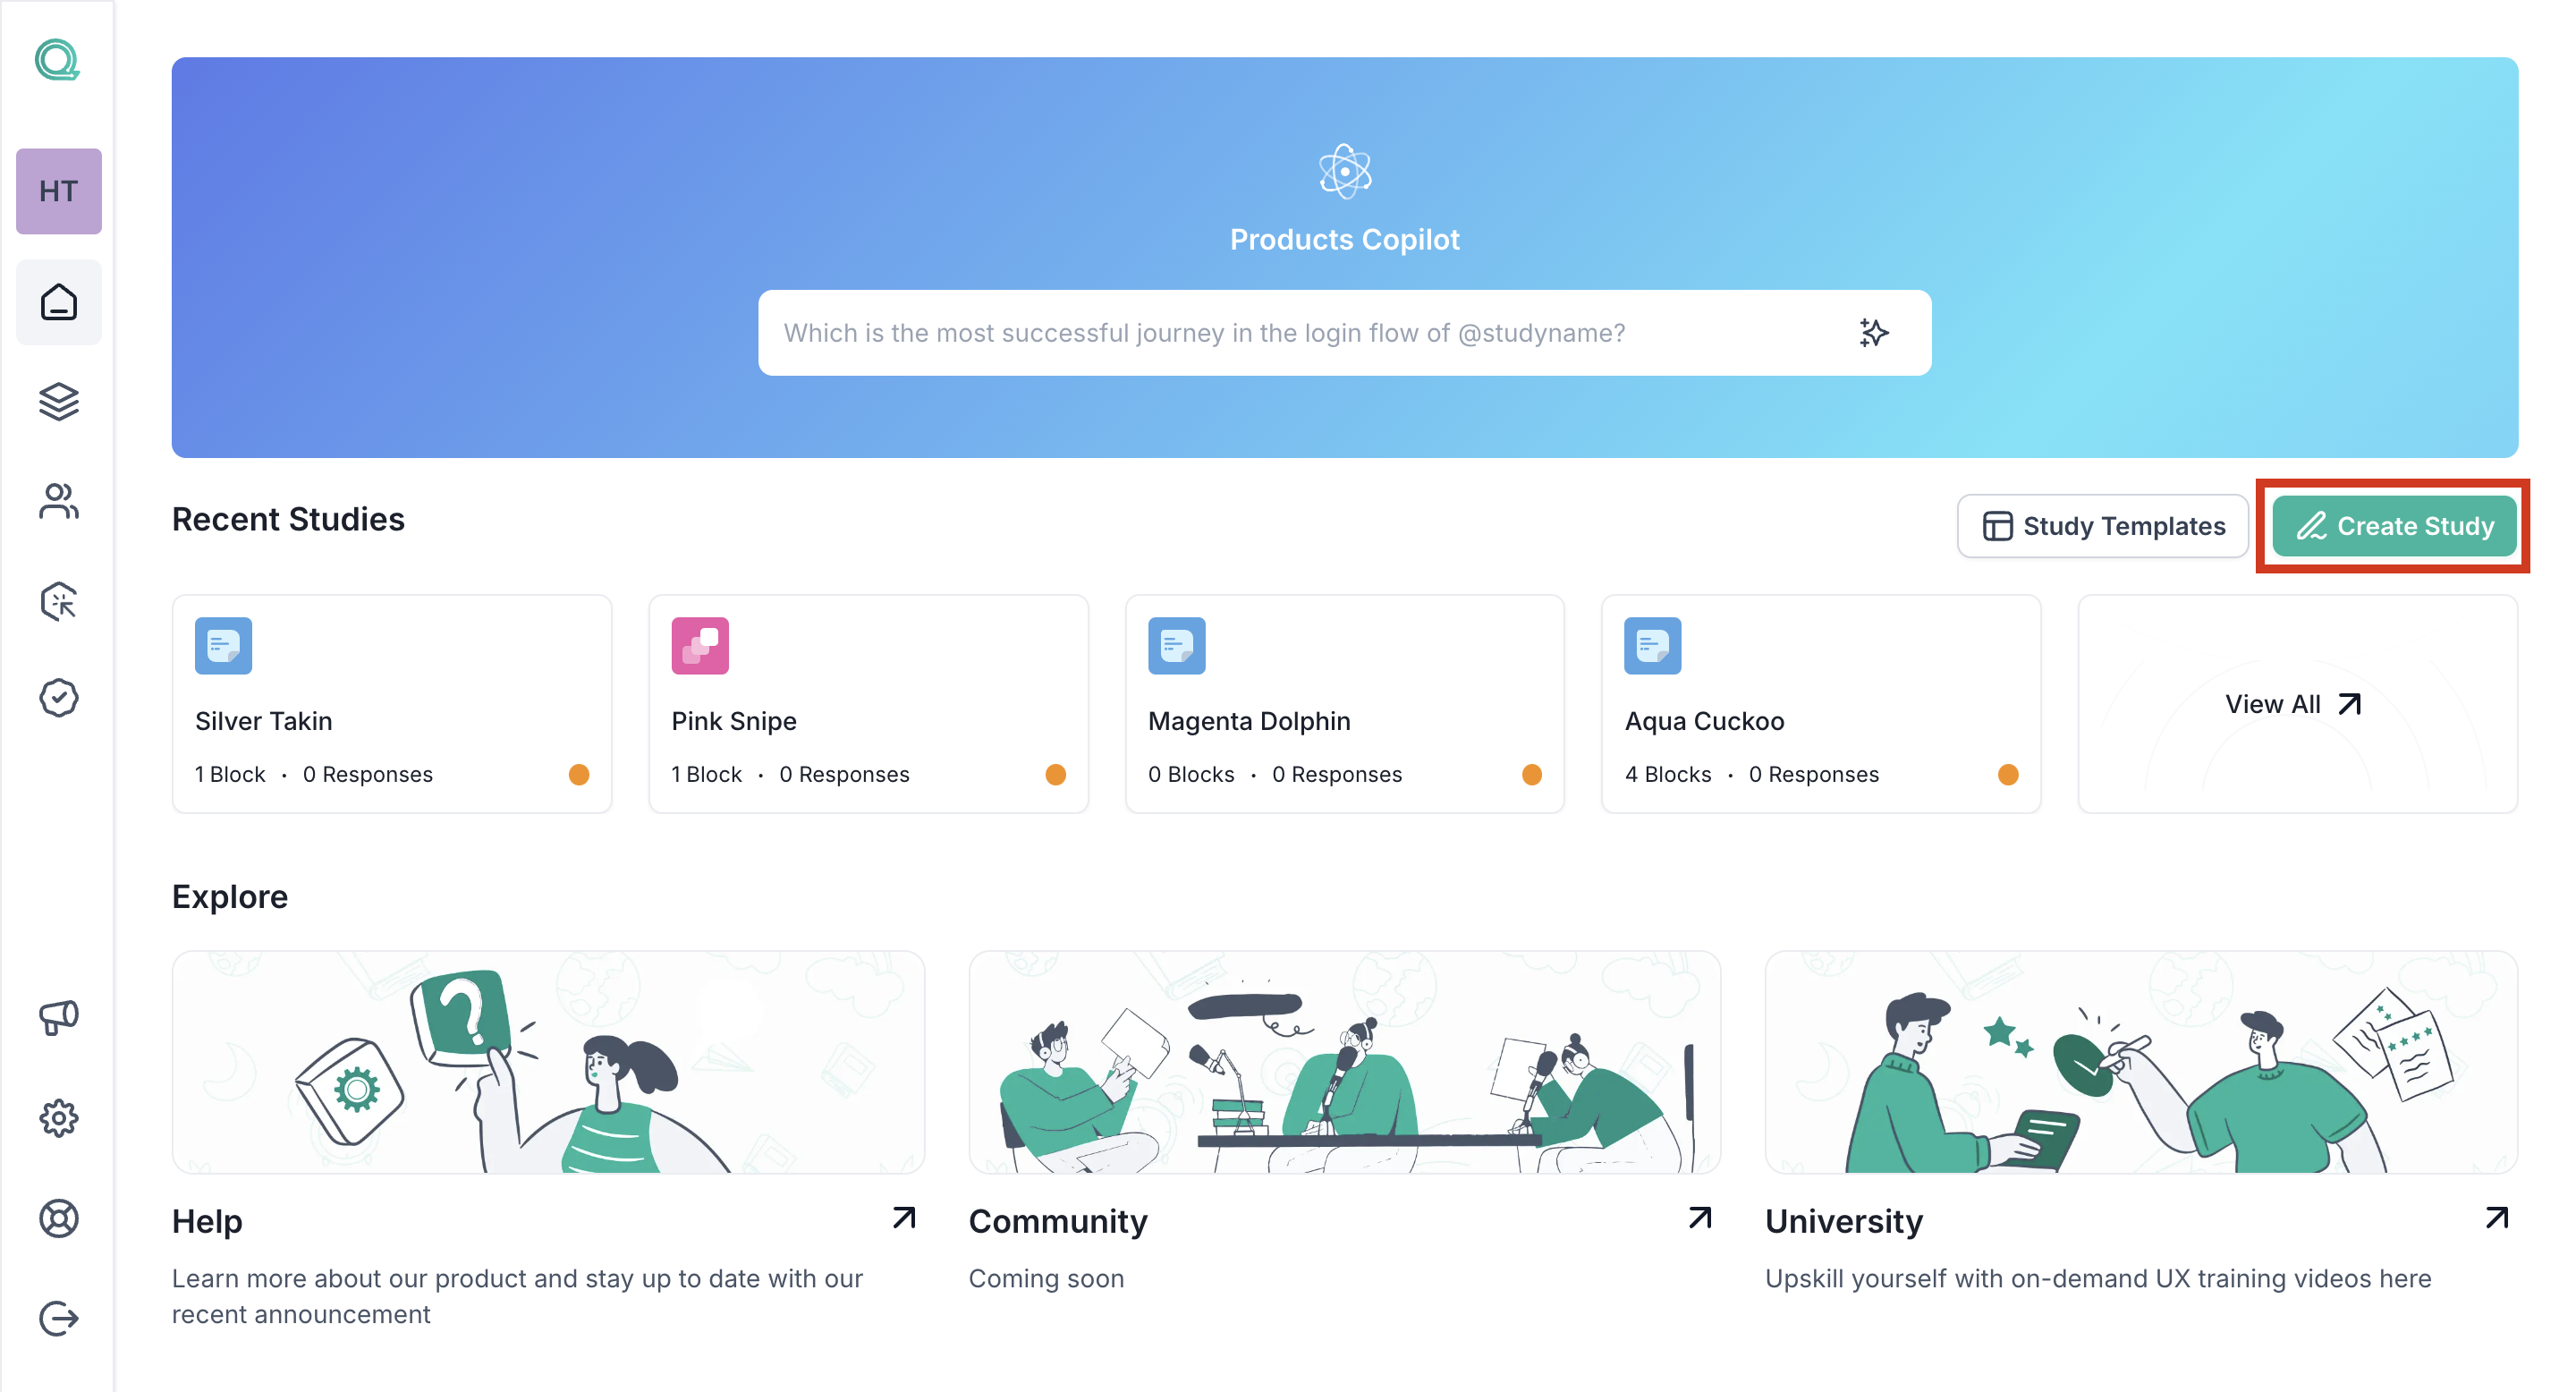
Step 1: Log in to your Qatalyst account, which will direct you to the dashboard. From the dashboard, click on the "Create Study" button to initiate the process of creating a new study.
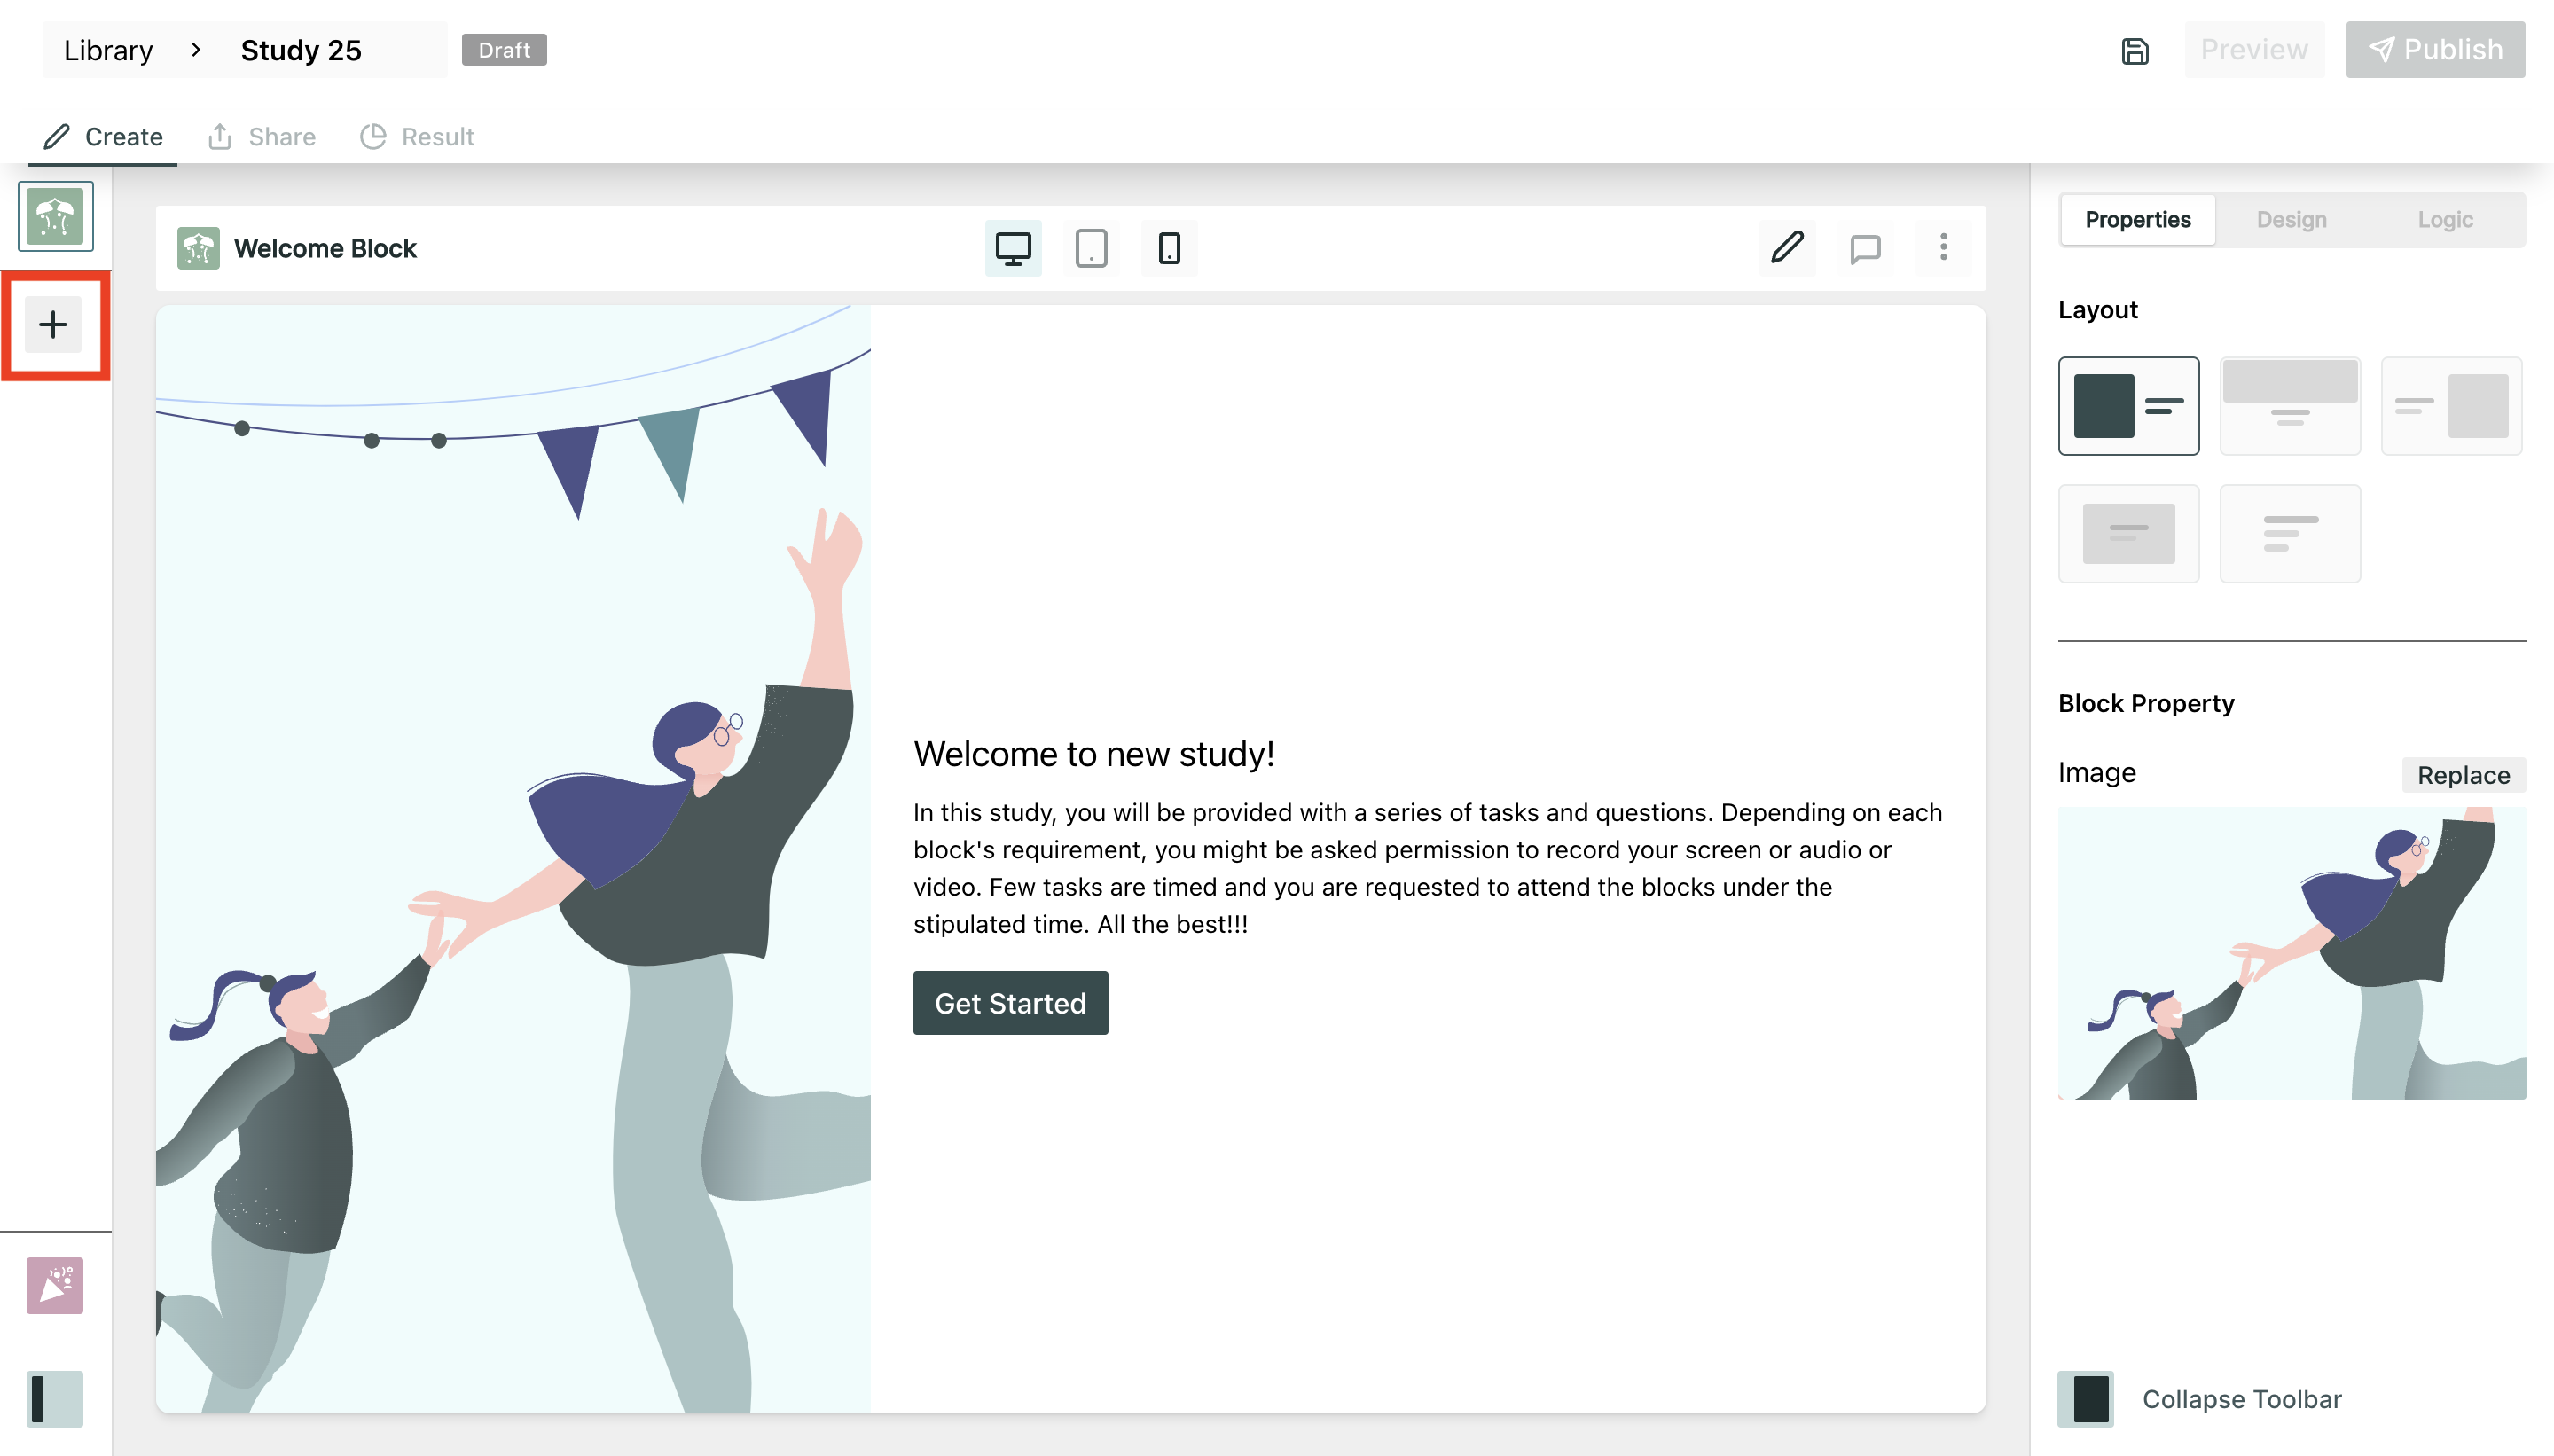
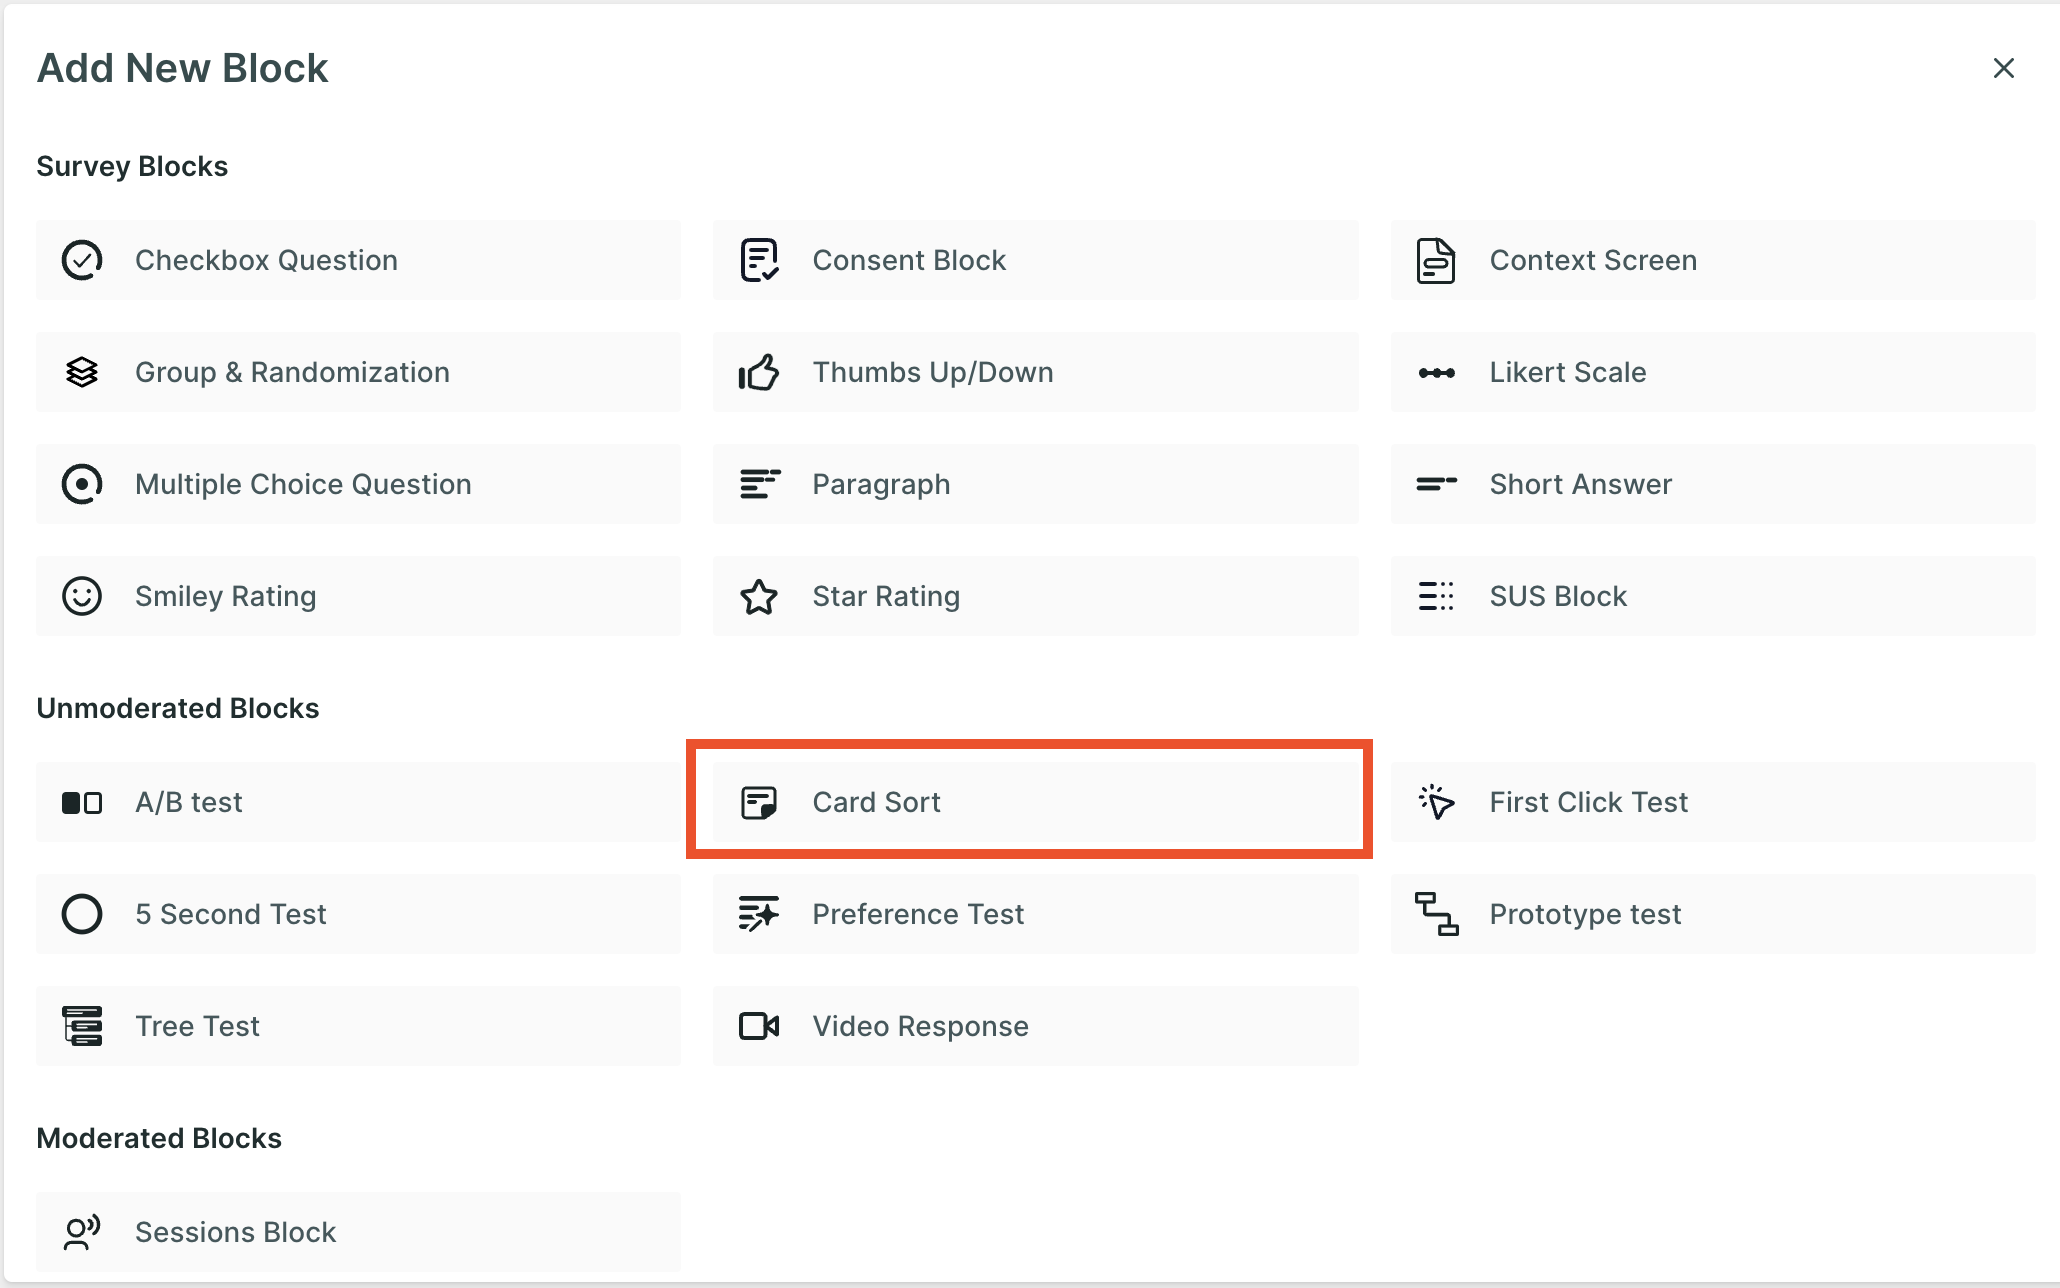
Step 2: Once you're in the study creation interface, locate the "+" button and click on it to add a new block. From the list of options that appear, select the "Card Sorting" option.
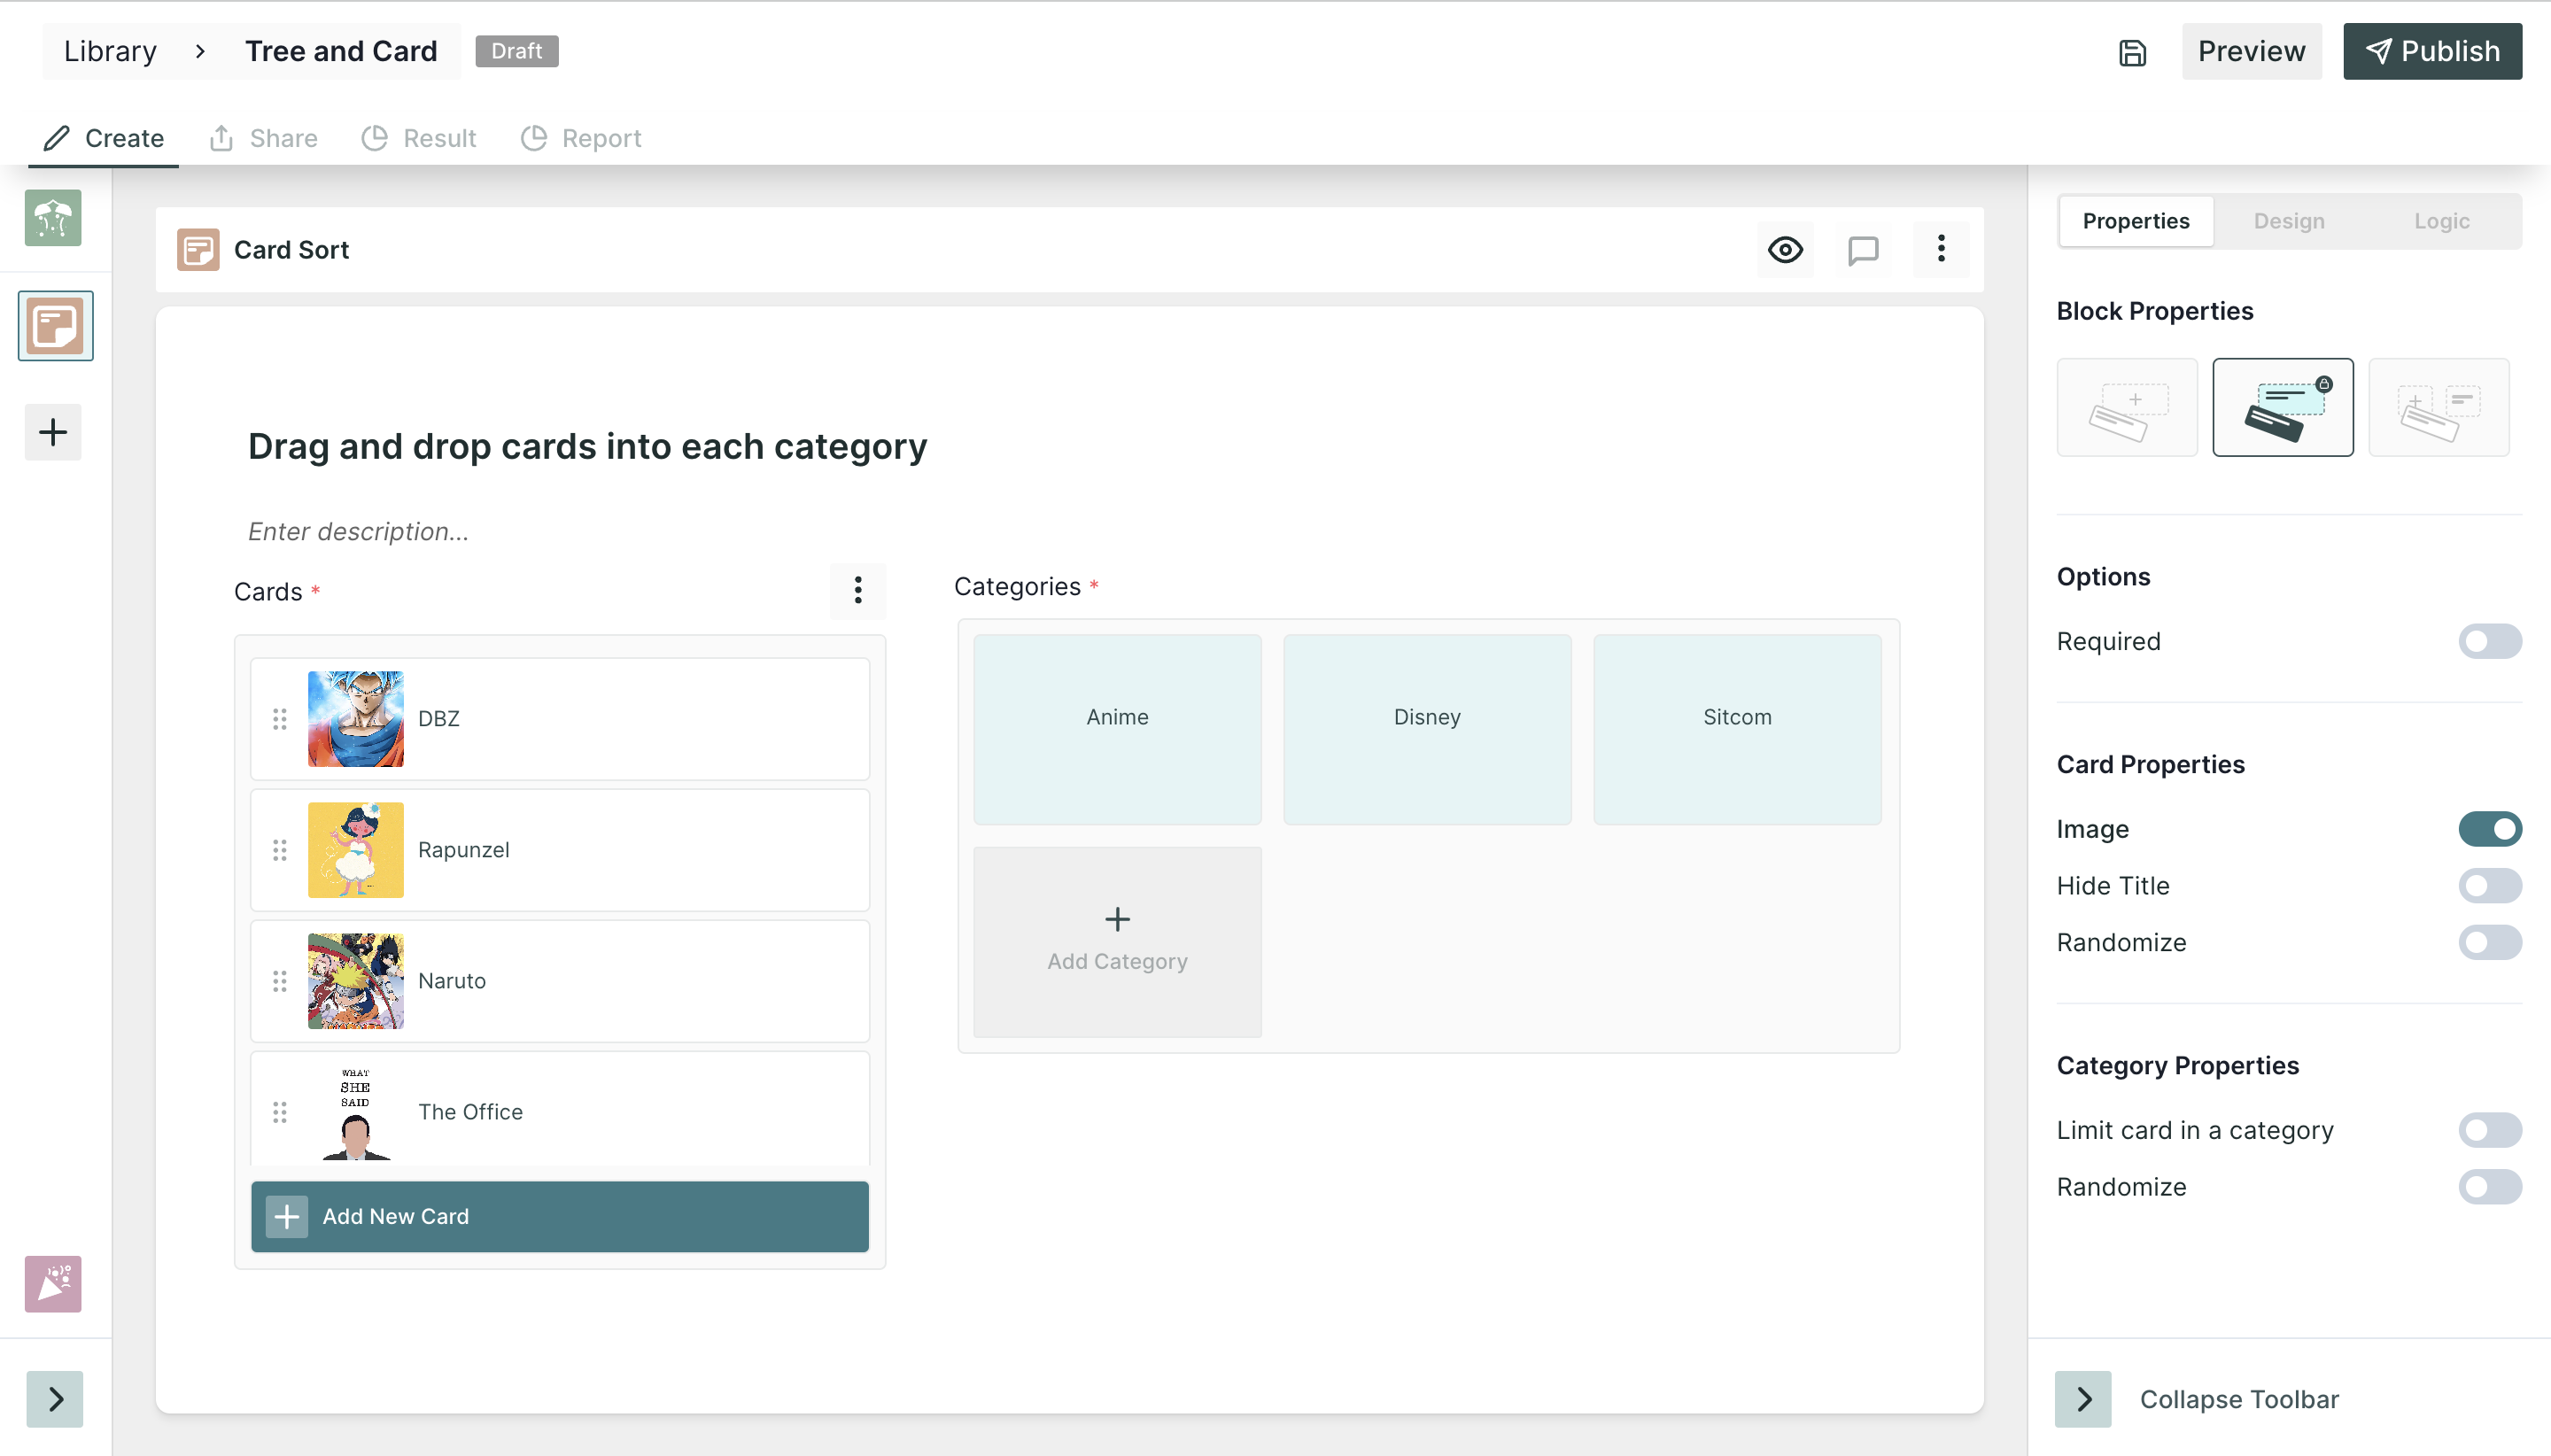
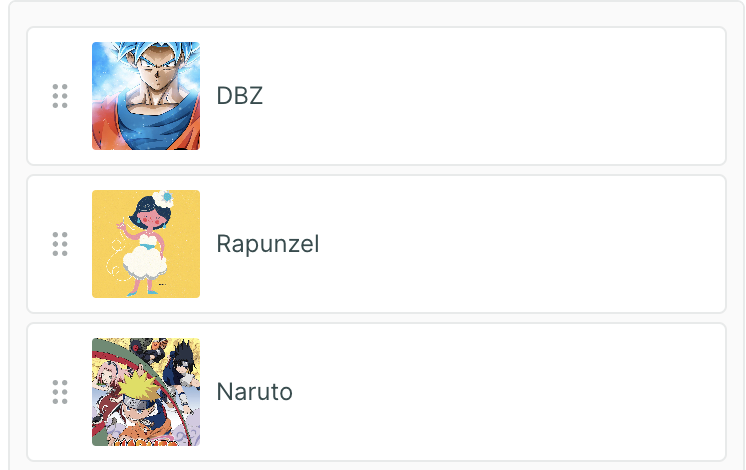
Step 3: Here, you can add the task and add multiple cards and Categories by clicking on the "+" button available. There are multiple properties and options also available to enhance the experience.
Step 3: To further enhance your study, continue adding additional survey blocks. Utilize the same process described in Step 2, clicking on the "+" button and selecting different block types to ask a variety of questions related to the test.
Properties ⚙️
1. Card Property
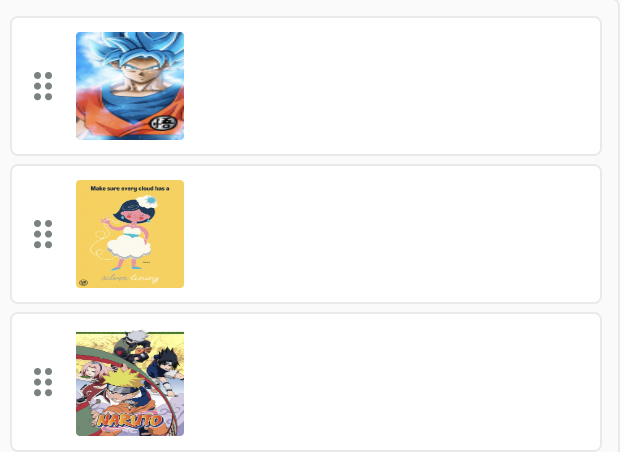
a. Image: An Image will also appear on the card along with the text.
b. Hide Title: The card will appear without the text; this option can be enabled if you have an image added to the cards.
c. Randomize: The cards will appear in random order.
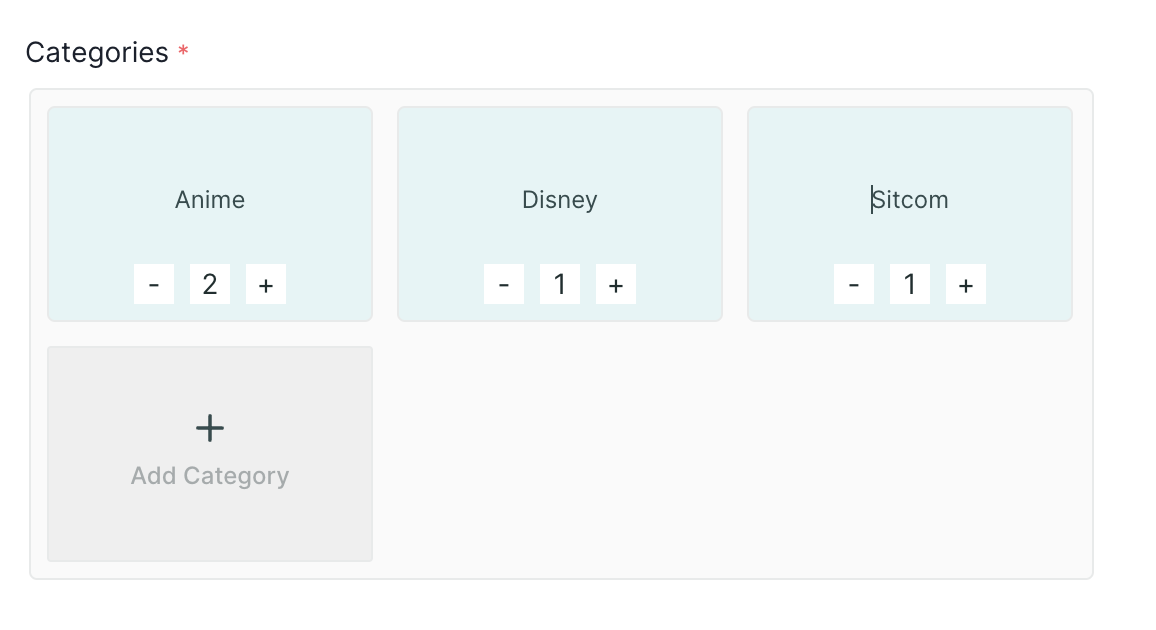
2. Card Category
1. Limit card in category: Using this property, only the given number of cards can be added to a particular category.
2. Randomize - The category will appear in random order.
Required - Taking this test is mandatory; the respondent will not be able to move to another question without taking this test.
Result View 📊
In the result section of a card sort, you will find the quantitative data about the selection made by different respondents.
In the Categories and Cards section, you will find the following two views for the result data:
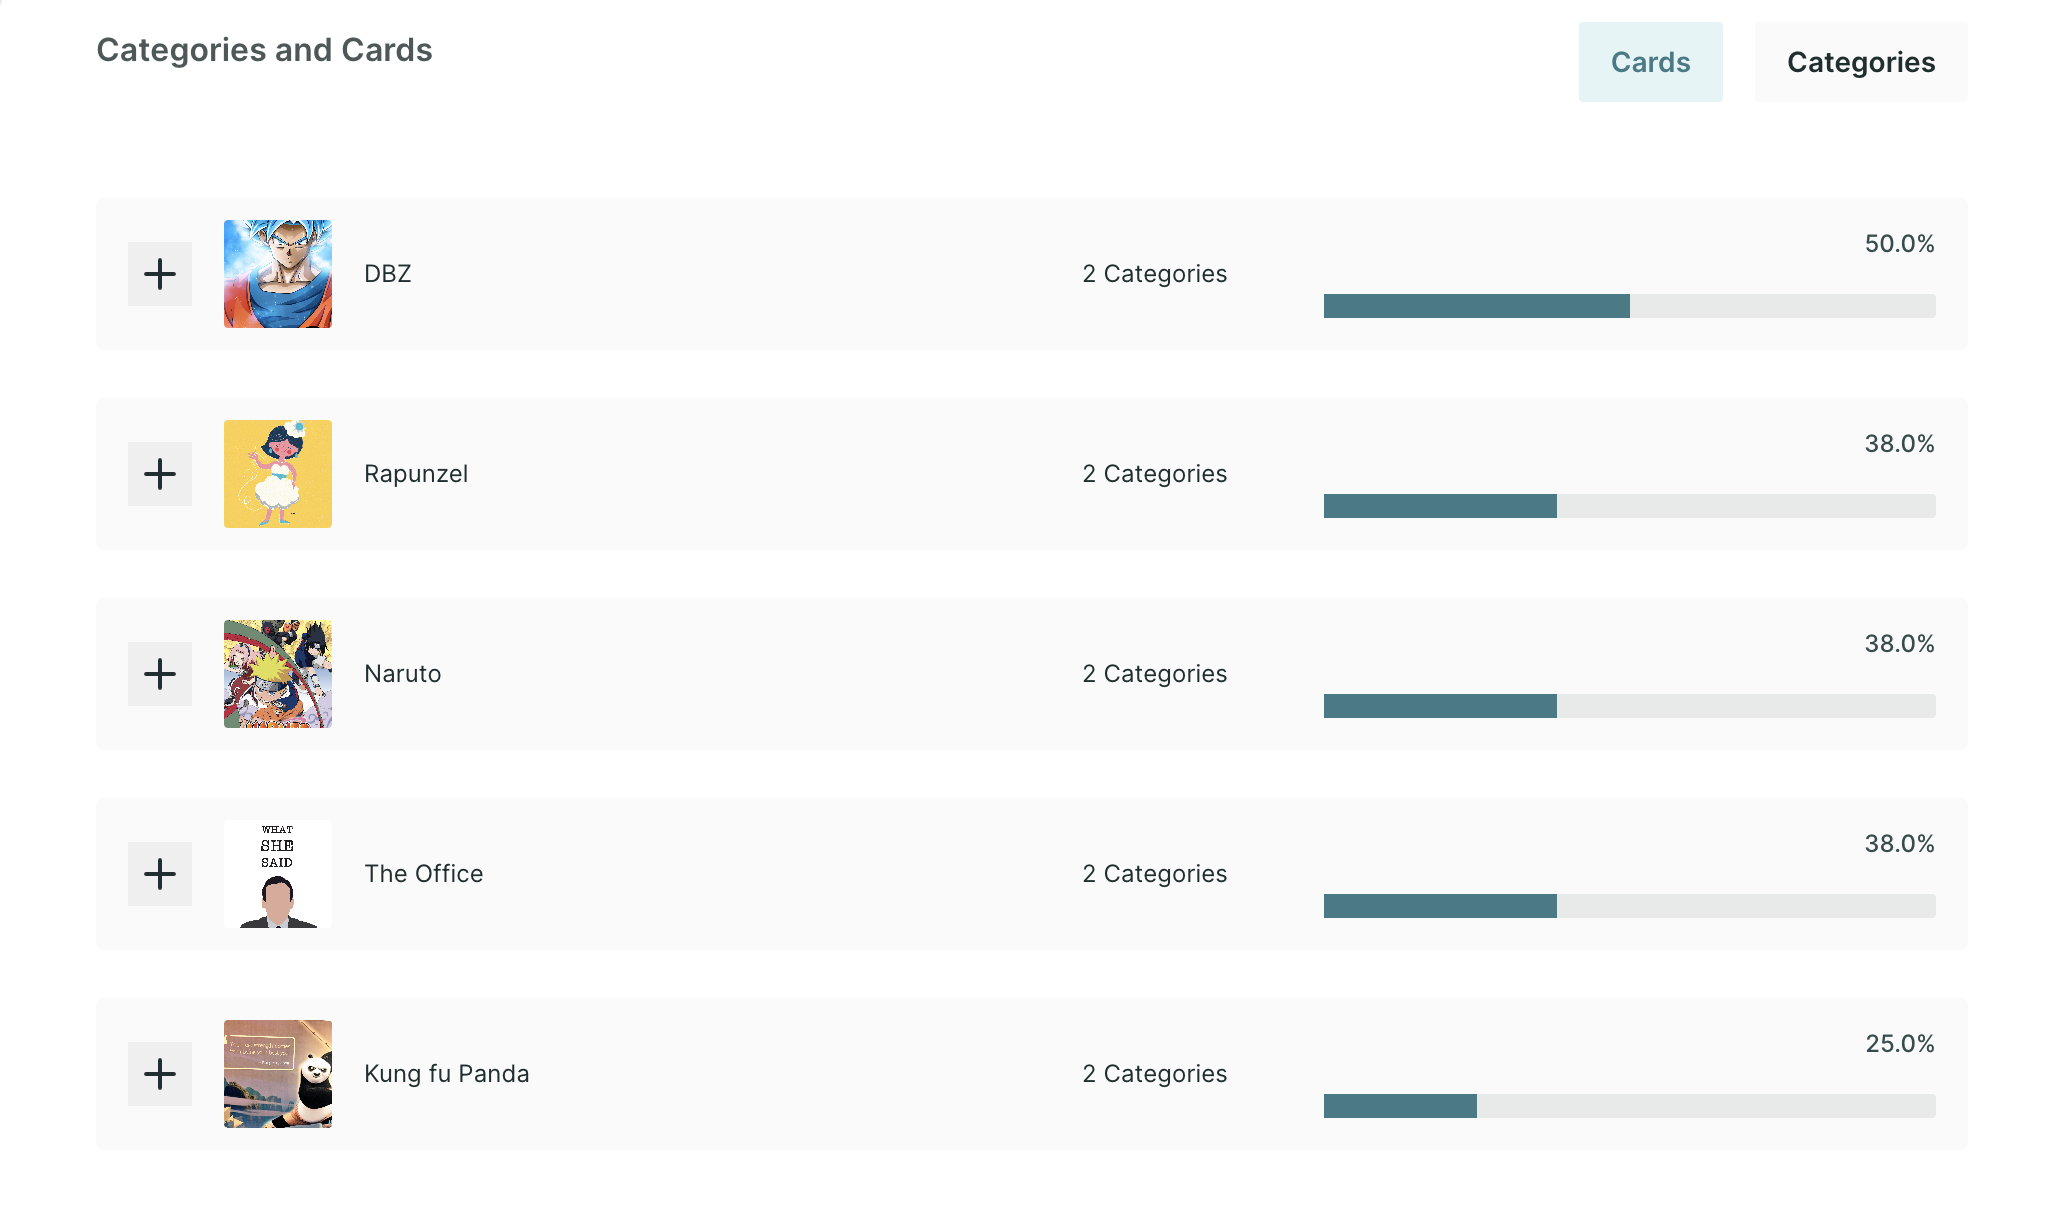
Card View: It will show the information and the number of categories in which they are added, along with the agreement percentage. By clicking on the plus icon, you can get information about the categories to which these cards are added.
How to read this data?
From the first column, users can infer that the "DBZ" card is added in two categories, and the agreement percentage is 50%, which means users agree that this card belongs to two categories.
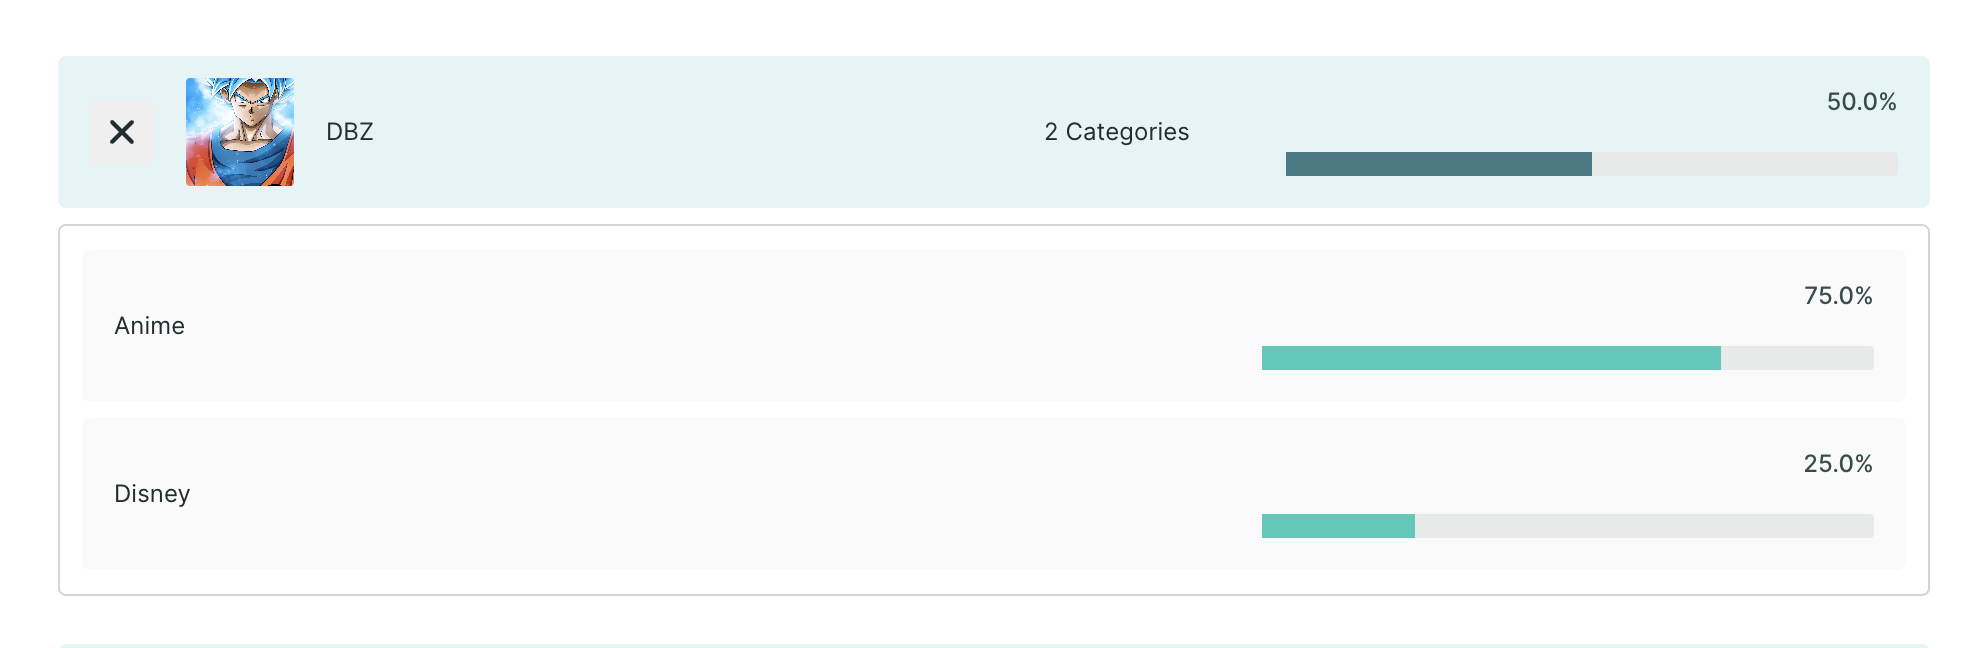
You can also expand the cards and view the percentage of users who have added the card in a particular category.
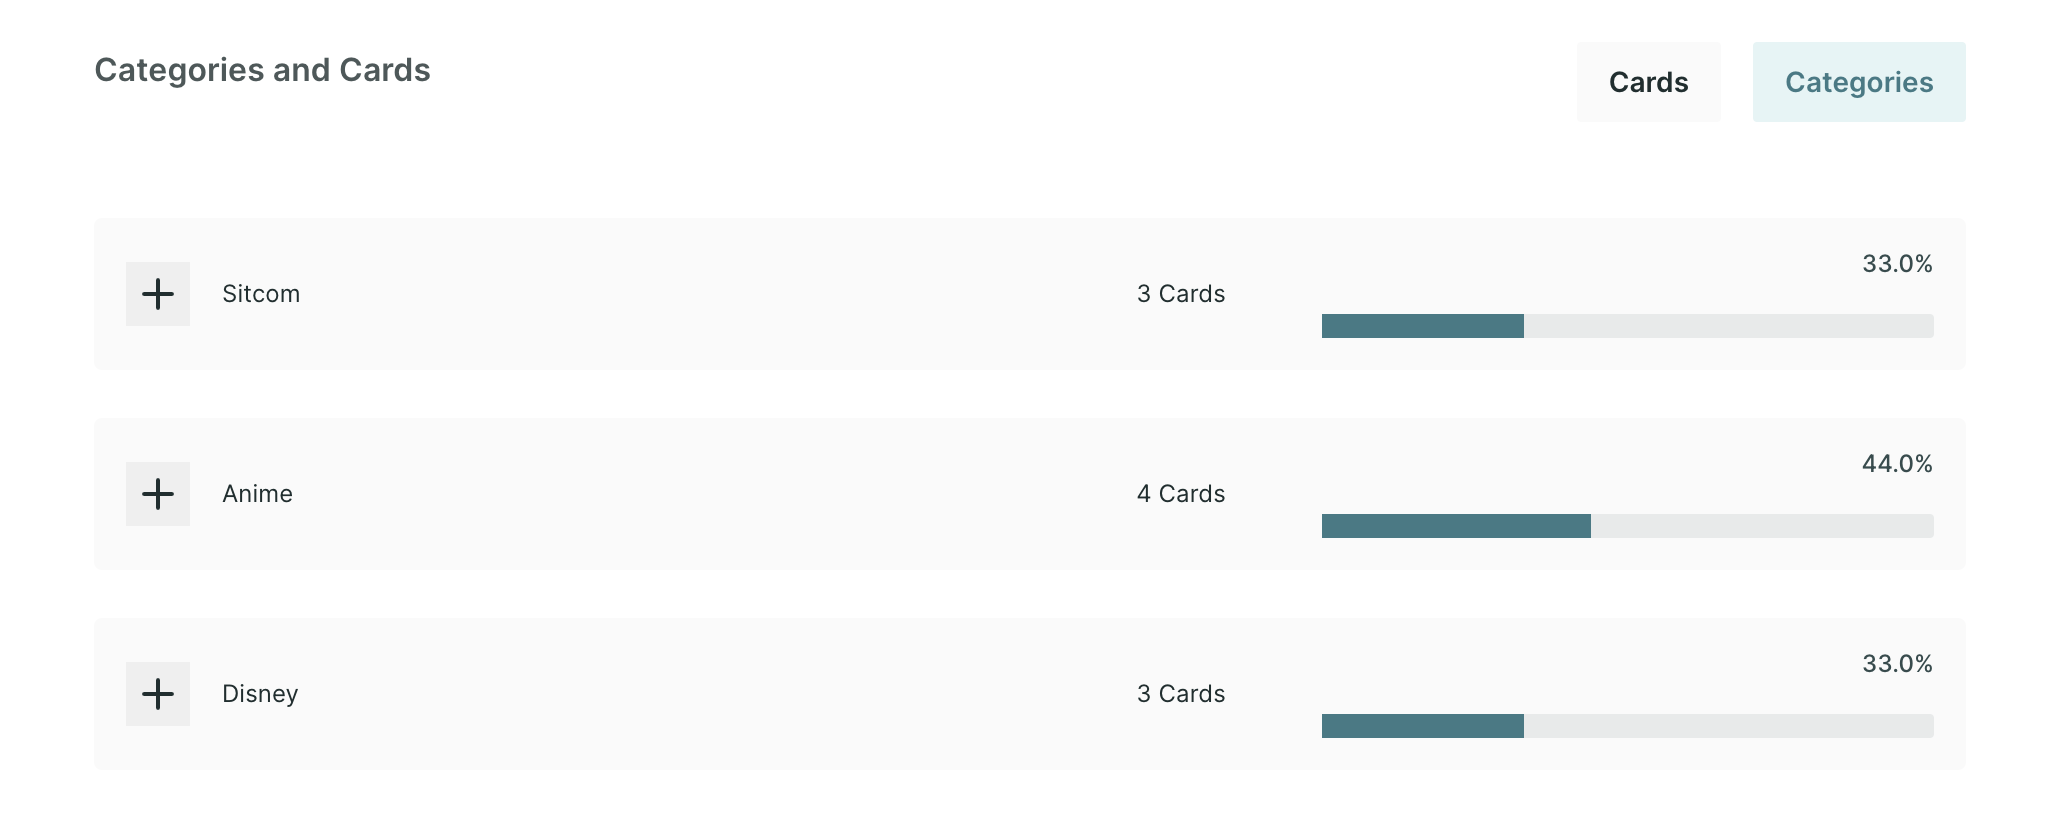
Category View
In the category view, the user can view the category names and the number of cards added in that category, along with the agreement matrix.
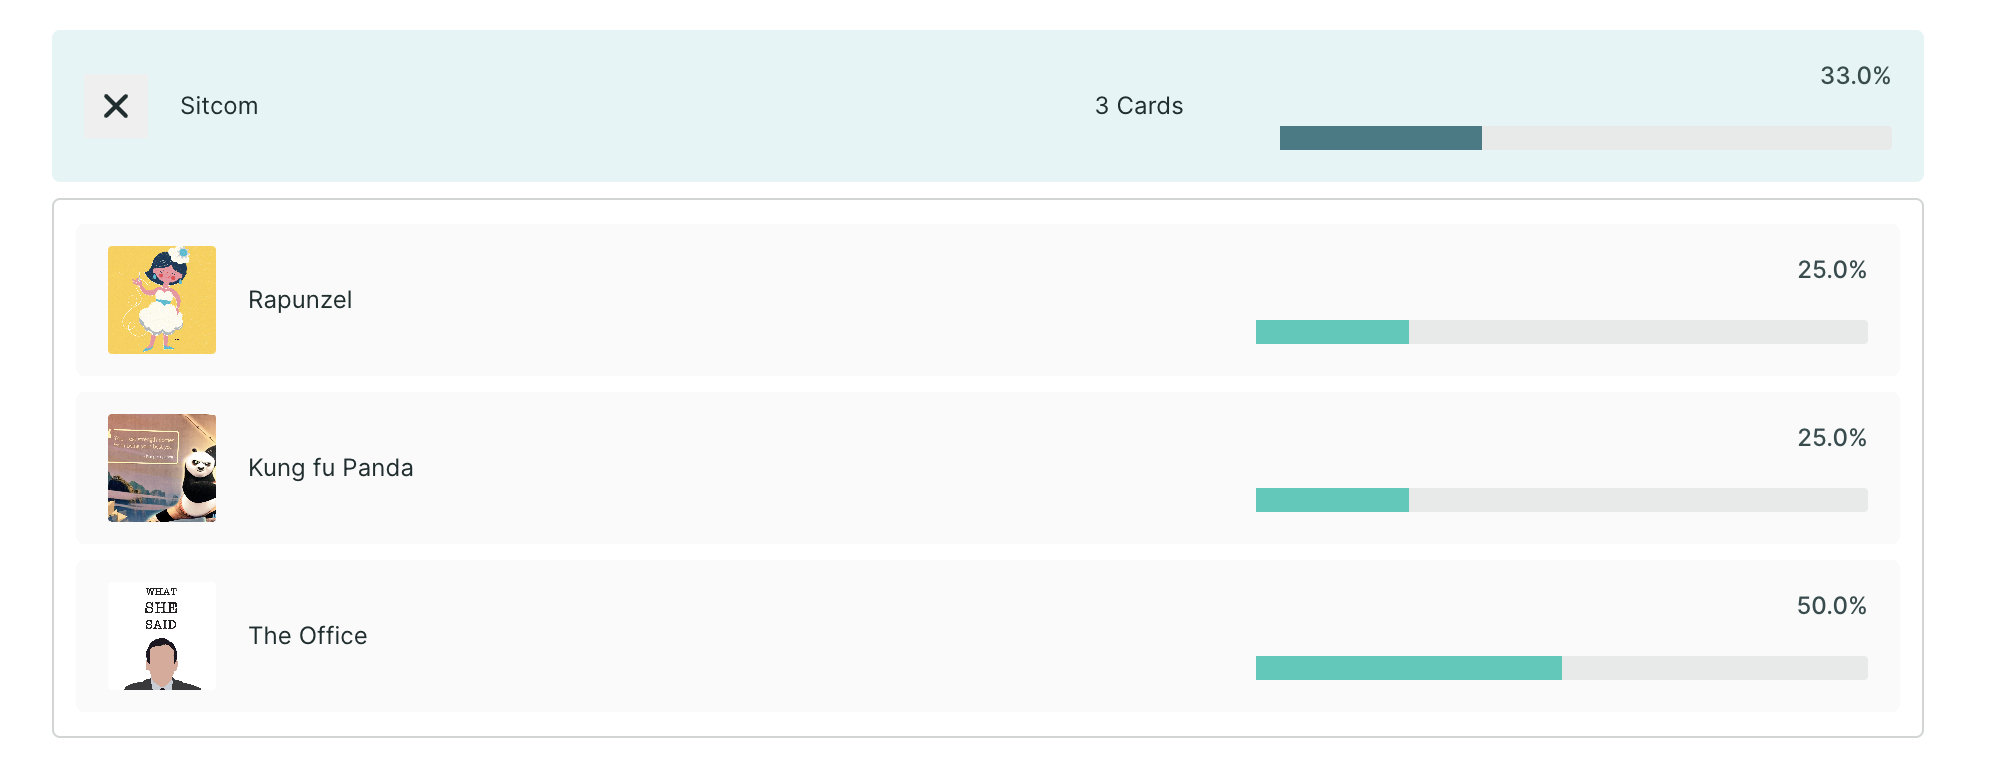
After expanding the card, users can view the cards added in that category and the percentage of users who have added them.
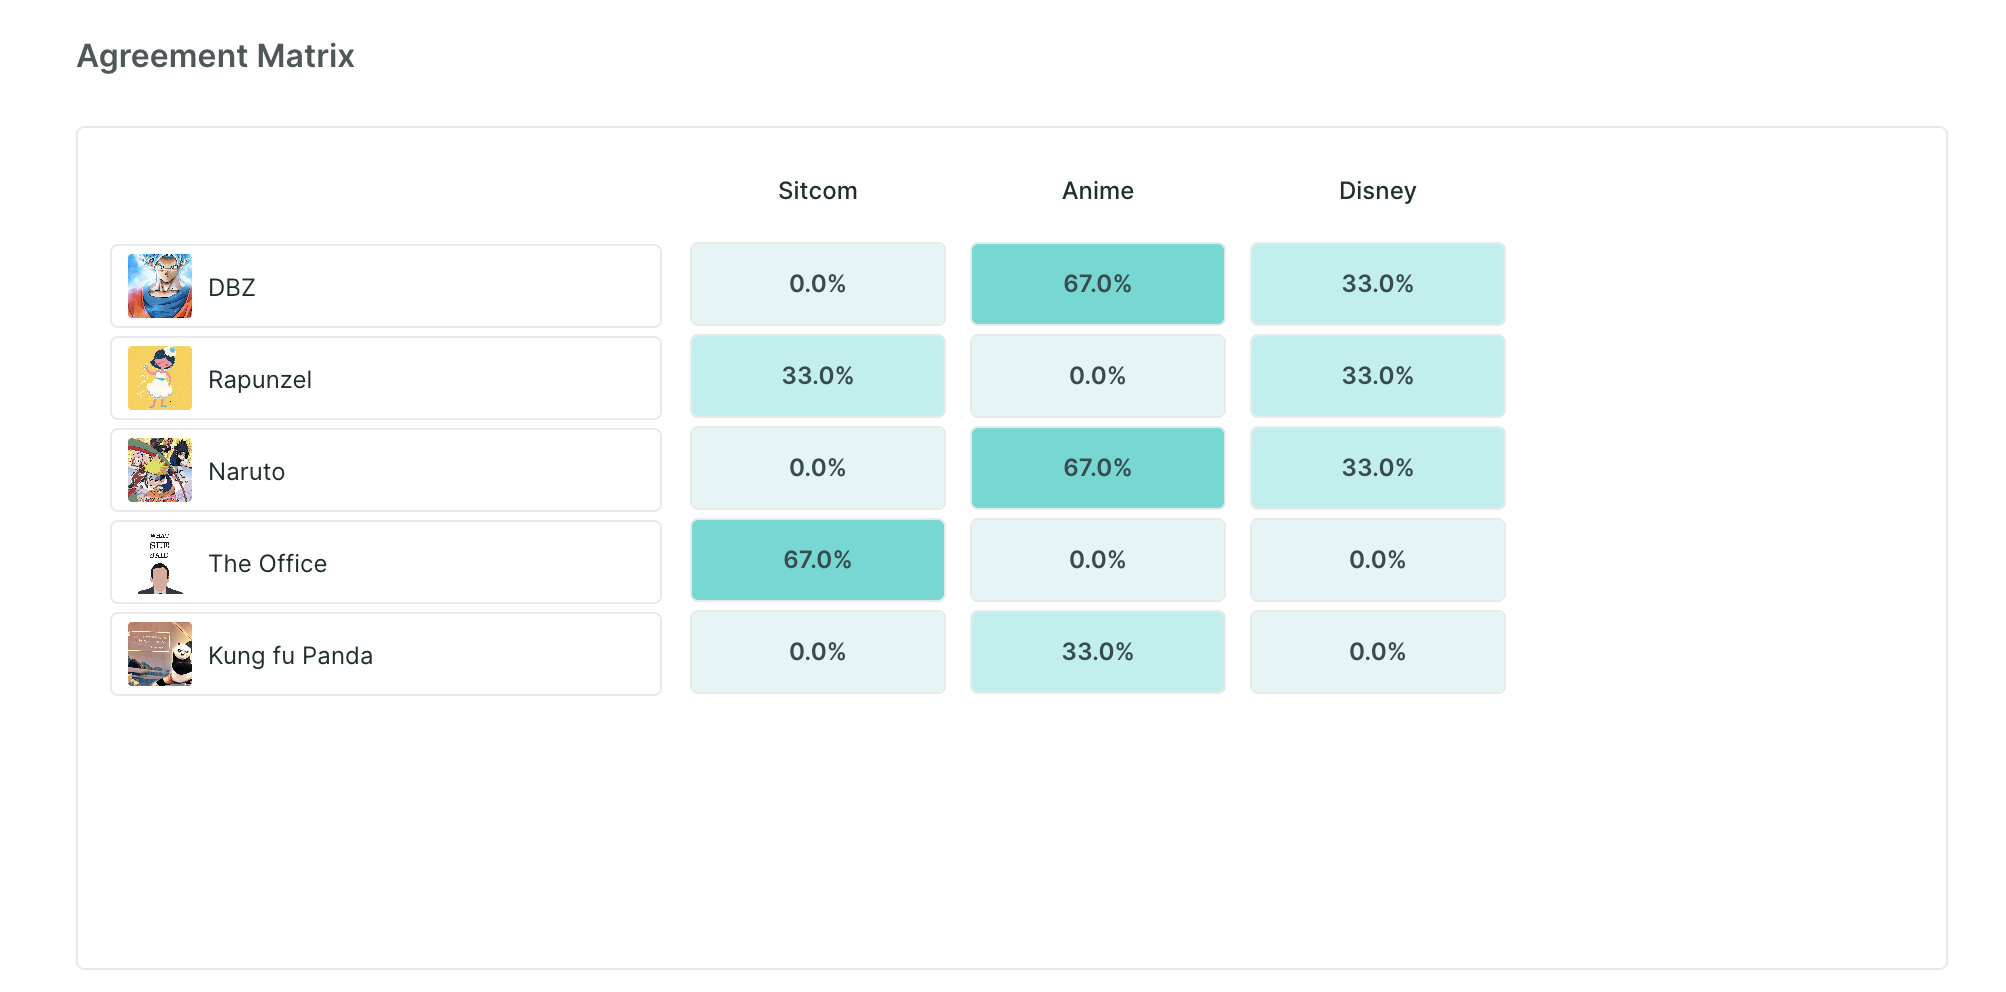
Agreement Matrix
An agreement matrix is a visual representation of how often users agree that a card belongs in each category in a card sort. It is a table with rows representing the cards and columns representing the categories. Each cell in the table indicates the agreement rate for a card in a category. The agreement rate is the percentage of users who placed the card in that category.
The agreement matrix can be used to identify which categories are most agreed upon by users, as well as which cards are most ambiguous or difficult to categorize. It can also be used to identify clusters of cards that are often grouped together.